Distinct-count measures are helpful when analyzing a dataset where the number of distinct elements in a dimension plays a significant role.
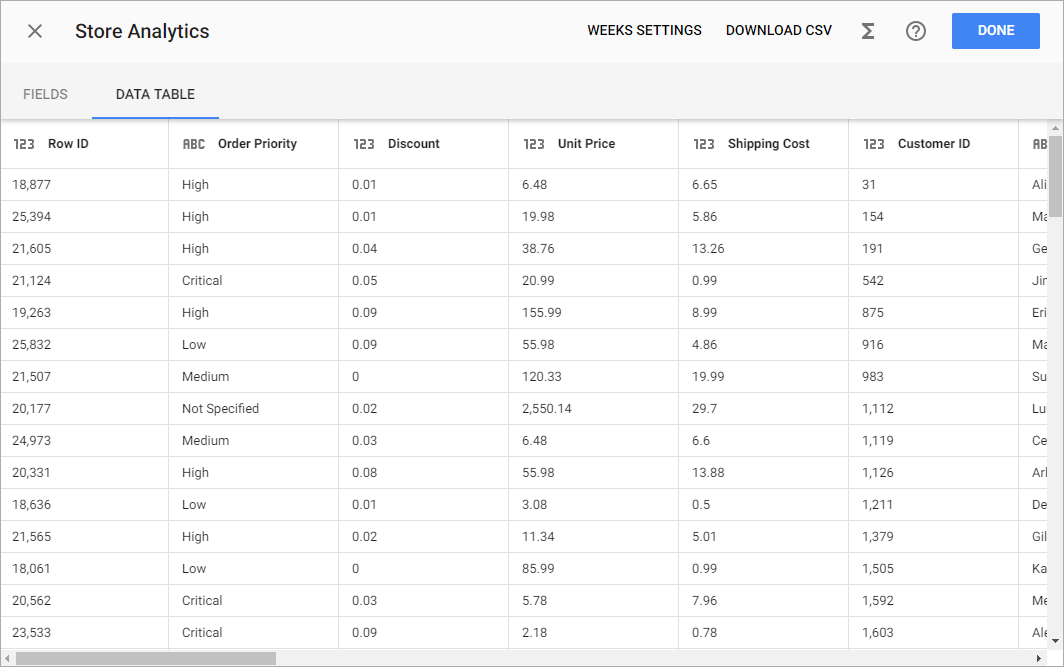
Let’s take a look at this sample data from an online store with lots of order information like customer name, city, product category, etc. Number of records won’t help much here since it only reflects number of order positions irrespective of orders (be it one order or many).
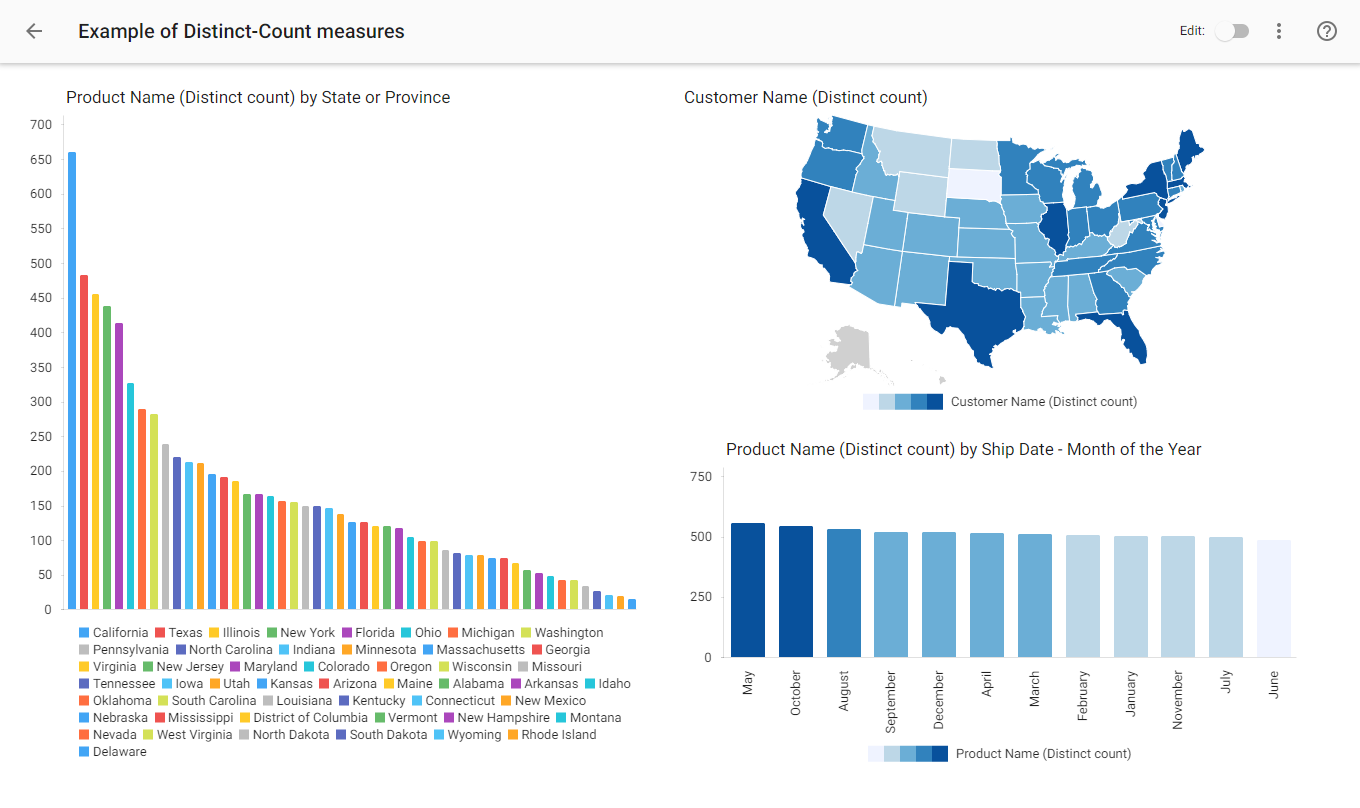
For the sake of the example we will calculate number of customers in each state, number of products ordered from each state, and number of products aggregated by calendar month: for that we shall need distinct-count measures from the Customer Name and Product Name columns.
The Distinct-Count measures can be set up during dataset creation, or on a prepared dataset in the Dataset editor, by clicking the appropriate field on the Fields tab or column on the Data table tab (for the fields/columns with categorical data – string or geography types) and selecting the checkbox for the Add distinct-count measure option.
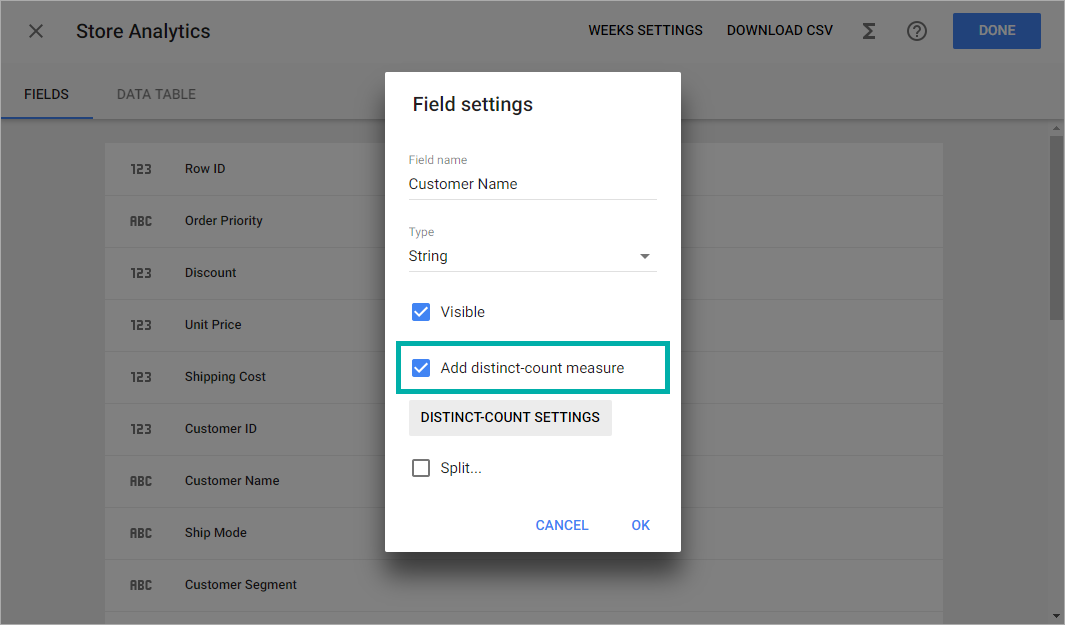
After you enable the Add distinct-count measure option, you can set the desired name and format of a new measure by clicking on the Distinct-count settings button.
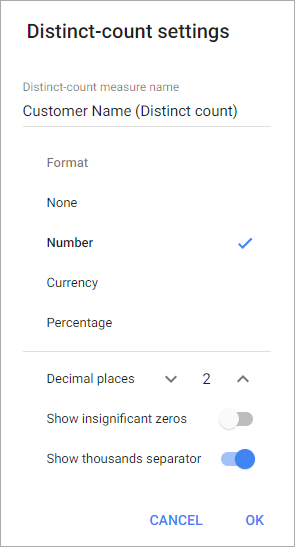
Choose one of the existing formats for the distinct-count measure:
- None – values are displayed as integer values.
- Number – values are displayed as integer values (decimal place is 0) or decimals (decimal place is from 1 to 5).
- Currency – values are displayed as monetary units.
- Percentage – values are displayed as percentages.
For the number, currency, and percentage formats you can set decimal places (from 0 to 5), show or hide insignificant zeros for decimals, and display or hide thousands separator.
Keep in mind that the chosen format of the measure affects the chart labels. To change labels, change format of the distinct-count measure in the Dataset editor or use Format > Elements > Labels settings in the Chart editor.
Once the distinct-count measure is created, the DC icon appears on the Fields tab in the row with the appropriate field name.
Measures for charts will be calculated from distinct elements of the chosen dimensions with applied filters and grouping.