

From this article you can learn:
- How to integrate your Freshdesk account with Slemma
- How to get data from Freshdesk
- How to create a chart on the Freshdesk
Creating an Integration
From your Slemma account, head over to the Library page and click the plus button at the bottom right. Select Integration from the submenu.
In the following page, you can find Freshdesk with one of the following ways:
- Scroll down and select Intercom from the list of Integrations.
- Use search to find Intercom from the list of Integrations.
- Choose Intercom using All dropdown list > Customer Success.
You’ll see the Integration settings dialog window. Enter your Freshdesk domain and API key (here you can find the instruction on how to find your API key).
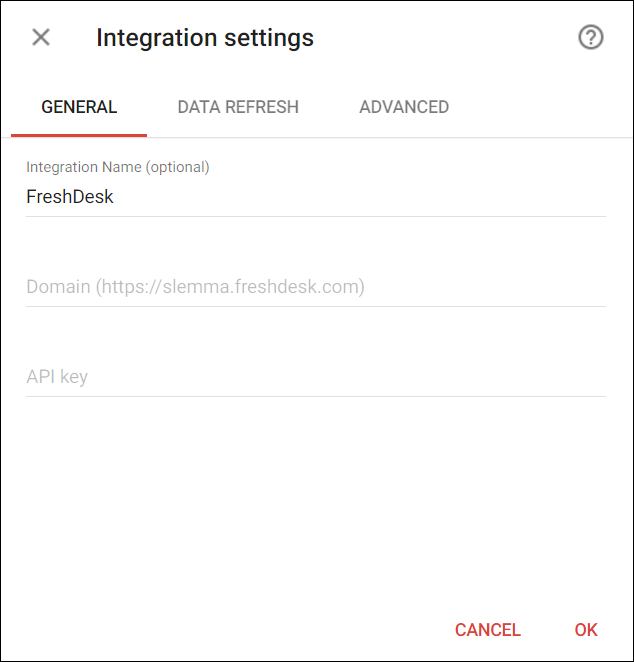
You can select the frequency for the automatic updates on the DATA REFRESH tab, or set weeks settings on the ADVANCED tab. Click OK.
After that, the integration will be created and it will appear in your account in the list of objects. Now you are able to share the integration with either individuals or the entire Team, rename or remove the integration. To view the options available for the integration, right click it in the list.
Creating a Dataset
A dataset is a collection of data in a tabular format that is created on one of the possible data sources. The datasets can be used to create dashboards or individual charts.
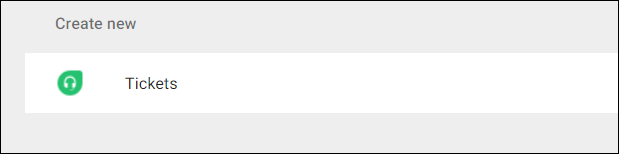
To create a dataset, click your Freshdesk integration in the list and select Browse datasets. From the following page, select which data you want to add to use in your charts.
NOTE: Cloud Service Integrations have prebuilt datasets that are not editable.
Click dataset’s name for a description of each dataset.
This data source contains information about all your users such as user count by location, and your custom fields per user. Dimensions Measures
Creating a Chart
Click a dataset or integration and select Create dashboard/Create saved chart to start building a chart.
From the next page, you can choose to create your own chart from scratch, or you can apply one of the templates we created.
- If you choose to build a new chart from scratch (“Blank” option), the Chart designer will open. Go here to learn how to create a chart in the Chart designer.
- If you choose a template, a new chart will be added to a dashboard/saved chart/presentation (depending on the way you start the chart creation).