

In this article, you’ll find the answers to the following questions:
- How to connect my Retreaver account with Slemma?
- How to get data from Retreaver?
- How to create a chart on my Retreaver integration?
Creating an Integration
To create an integration, head over to the Library tab (your home page) and click the plus button at the bottom right. Select Integration from the submenu.
From the next page, you can find Retreaver with one of the following ways:
- Scroll down and select Retreaver from the list of integrations;
- Use the search icon from the top right corner of the window;
- Open the All dropdown and select Other.
Click the integration.
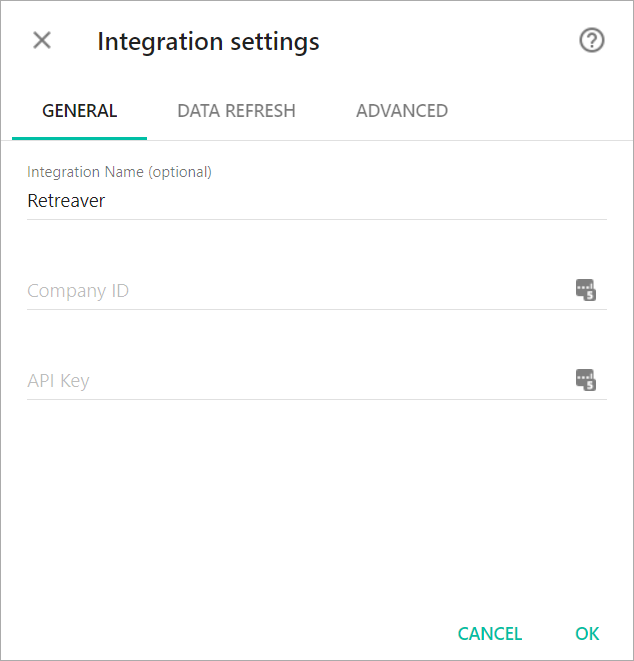
You’ll see the Integration settings dialog window. You can read more about data refresh options and advanced settings in the appropriate articles. Insert the credentials to connect to your account.
After authorization, the integration will be created and it will appear in your account in the list of objects. Now you are able to share the integration with either individuals or the entire Team, rename or remove the integration. To view the options available for the integration, right click it in the list.
Creating a Dataset
Dataset is a collection of data in a tabular format that is created on one of the possible data sources. The datasets can be used to create dashboards or individual charts.
Cloud Service Integrations have prebuilt datasets that are not editable.
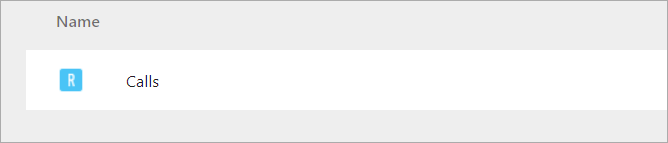
To create a dataset, click your Retreaver integration in the list and select Browse datasets.
Creating a Chart
Click a dataset or integration and select Create dashboard/Create chart/Create presentation to start building a chart (please note that presentations are available starting from the Standard Plan).
From the next page, you can choose to create your own chart from scratch, or you can apply one of the templates we created.
- If you choose to build a new chart from scratch (“Blank” option), the Chart designer will open. Go here to learn how to create a chart in the Chart editor.
- If you choose a template, a new chart will be added to a dashboard/saved chart/presentation (depending on the way you start the chart creation).