AdWords is the premier platform for intent based advertising.
We support AdWords API v201809.
In this article, you’ll find the answers to the following questions:
Creating an Integration
From your Slemma account, head over to the Library page and click the plus button at the bottom right. Select Integration from the submenu.
In the following page, you can find Google AdWords with one of the following ways:
- Scroll down and select Google AdWords from the Cloud services list.
- Use search to find Google AdWords from the list of Integrations.
- Choose Google AdWords using All dropdown list > Marketing.
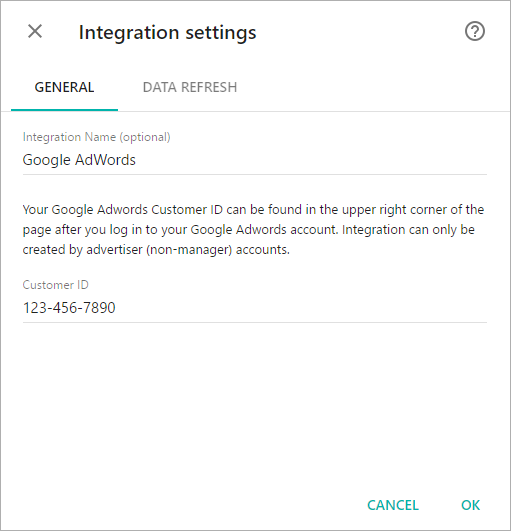
You’ll see the Integration settings dialog window. You can select the frequency for the automatic updates on the DATA REFRESH tab. Leave this page open for now – we’ll need it to complete the setup.

To get your Customer ID, log into your Google Adwords account. Find your ID at the top right corner of the page.
Enter your Customer ID into Integration settings window.
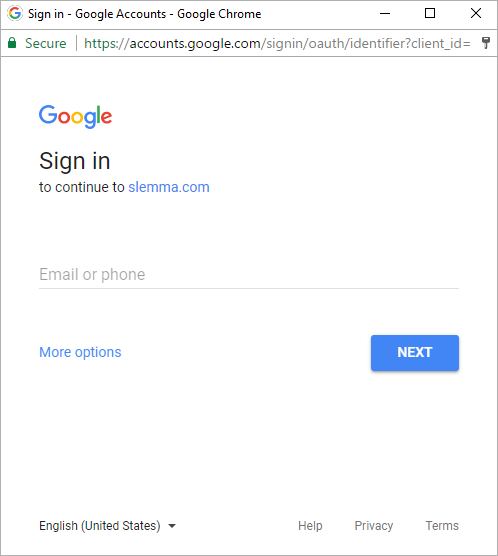
Login to your Google account and grant Slemma permission to access your Google Adwords data.

After providing your account details, you’ll be able to share the integration with either individuals or the entire Team, rename or remove the integration. To view the options available for the integration, right click it in the list.
You can now create charts and dashboards with your Google AdWords data.
NOTE: You are not able to create or edit datasets based on the Google AdWords integration. To create a chart on this integration, follow the steps below.
Creating a Chart
Click a dataset or integration and select Create dashboard/Create saved chart/Create presentation to start building a chart (please note that presentations are available starting from the Standard Plan).
From the next page, select one of the available AdWords reports as a source for your chart.
NOTE: Not all Google AdWords metrics and dimensions can be queried together. You can check if a dimension and metric combination is valid from within Google’s documentation from the above link.
Each report contains statistics that are aggregated to a specific level (or levels). For example: The Destination URL report includes all statistics aggregated at the destination URL level, one row per destination URL. The following table shows the list of reports and their key dimensions by which the aggregated data:
| Report | Dimensions |
|---|---|
| Account Performance | Account |
| Ad Group Performance | Ad Group |
| Ad Customizers Feed | Item ID |
| Ad Performance | Ad |
| Age Range Performance | Age Range |
| Audience Performance | Audience |
| Automatic Placements Performance | Placement |
| Bid Goal Performance | Bid Strategy Name |
| Budget Performance | Budget |
| Call Metrics Call Details | Call source |
| Campaign Ad Schedule Target | Campaign + Ad Schedule |
| Campaign Location Target | Campaign + Location |
| Campaigns Performance | Campaign |
| Creative Conversion | Keyword / Placement |
| Criteria Performance | Ad Group + Criteria Display Name |
| Destination URL | Destination Url |
| Display Keyword Performance | Keyword |
| Display Topics Performance | Topic |
| Final URL | Final Url |
| Gender Performance | Gender |
| Geo Performance | Country/Territory |
| Keywordless Category Performance | Top level categories First level sub-categories Second level sub-categories |
| Keywordless Query | Search term |
| Keywords Performance | Keyword |
| Label | Label Name |
| Paid and Organic Query | Query |
| Parental Status Performance | Parental Status |
| Placeholder Feed Item | Item ID |
| Placeholder | Feed placeholder type |
| Placements Performance | Placement |
| Product Partition | Criterion ID |
| Search Terms | Search term |
| Shared Set | Shared Set Name |
| Shopping Performance | Item Id |
| Top Content Performance | Ad Group + Criteria ID |
| URL Performance | URL + Criteria Display Name |
| User Ad Distance | Distance from location extensions |
| Video Performance | Video Title |

