ActiveCampaign

Estimated reading time: 7 min

In this article, you’ll find the answers to the following questions:

Creating an Integration

From your Slemma account, head over to the Library page and click the plus button at the bottom right. Select Integration from the submenu.

In the following page, you can find ActiveCampaign with one of the following ways:

  1. Scroll down and select ActiveCampaign from the list of Integrations.
  2. Use search to find ActiveCampaign from the list of Integrations.
  3. Choose ActiveCampaign using All dropdown list > E-Commerce.

You’ll see the Integration settings dialog window. You can select the frequency for the automatic updates on the DATA REFRESH tab, or set weeks settings on the ADVANCED tab. Leave this page open for now – we’ll need it to complete the setup.

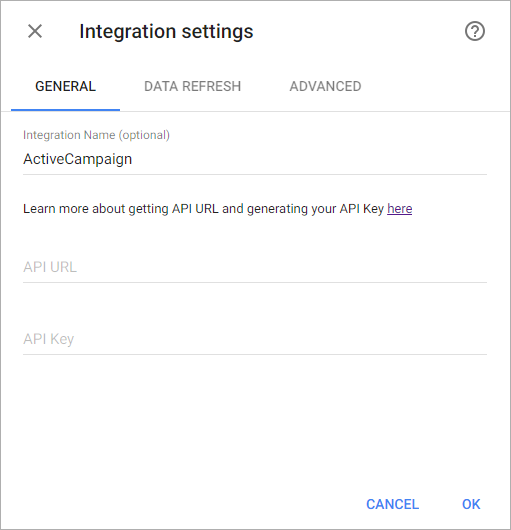
To set up the connection, you’ll need your ActiveCampaign API URL and API Key. To find your API URL and API Key, read this ActiveCampaign documentation.

Copy your API URL and API Key to the Integration settings window and click OK.

After authorization, you’ll be able to share the integration with either individuals or the entire Team, rename or remove the integration. To view the options available for the integration, right click it in the list.

Creating a Dataset

A dataset is a collection of data in a tabular format that is created on one of the possible data sources. The datasets can be used to create dashboards or individual charts.

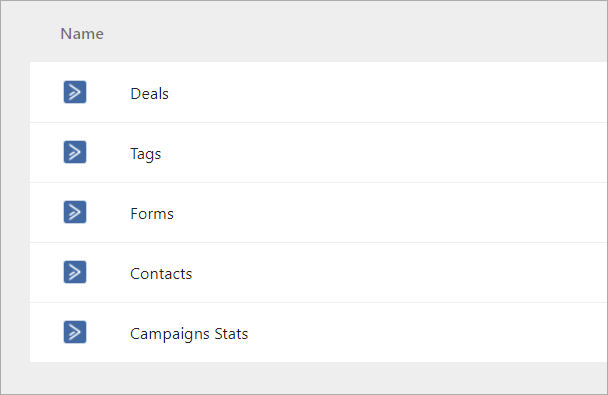
To create a dataset, click your ActiveCampaign integration in the list and select Browse datasets. From the following page, select which data you want to add to use in your charts.

NOTE: Cloud Service Integrations have prebuilt data sets that are not editable.

Click dataset’s name for a description of each dataset.

This data source contains statistics about your campaigns, opens count, clicks count, etc.

Dimensions

  1. Type – Type of campaign. Possible values: ‘single’, ‘recurring’, ‘responder’, ‘reminder’, ‘split’, ‘text’
  2. Campaign Name – Internal name of the campaign
  3. Created At – Date the campaign was initially created
  4. Send Date – Date the campaign started sending
  5. Modified At – Date the campaign was last modified
  6. Source – How the campaign was created. Possible value: ‘web’, ‘api’, ‘copy’, ‘recurr’, ‘system’
  7. Status – Status of this campaign
  8. Type Link – Type of link tracking enabled for the campaign. Possible values: ‘all’, ‘mime’, ‘html’, ‘text’, ‘none’
  9. Recurring – If this is a recurring campaign, how often it repeats. Possible values: day1, day2, week1, week2, month1, month2, quarter1, quarter2, year1, year2. Values ending with 1 mean “every”, and ending with 2 mean “every other”
  10. Track Links Analytics – Whether or not Google Analytics read tracking is enabled
  11. Track Reads – Whether or not read/open tracking is enabled for this campaign
  12. Track Reads Analytics – Whether or not Google Analytics read tracking is enabled
  13. GA Campaign Name – The Google Analytics campaign name (used for organizing within Google Analytics)
  14. Survey ID – The unique ID from the SurveyMonkey personalization tag, which is the URL ID for the survey
  15. Split Type – If this is a split-type campaign, the type of split mailing. Example: ‘even’ (send each message to even number of contacts). Possible values: ‘even’, ‘read’, ‘click’. If ‘read’ or ‘click’ is used, ‘split_offset’ and ‘split_offset_type’ need to be present. In that case it will use a “winner” scenario
  16. Reminder Type – If this is an auto-reminder (subscriber date-based) type campaign, match just a month and the day (yearly), or match year as well. Possible values: ‘month_day’, ‘year_month_day’
  17. Scheduled Date – The date the campaign is scheduled to send
  18. Reply Enable – Whether or not reply tracking is enabled for this campaign
  19. Automation Name – Name of the automation that this campaign is associated with
  20. List Names – Names of lists used for the campaign

Measures

  1. Send Amount – Total amount of contacts actually sent this campaign
  2. Total Amount – Total amount of contacts determined to receive this campaign
  3. Opens – Total amount of opens for this campaign (including multiple opens by the same contact)
  4. Unique Opens – Total amount of distinct (unique) contacts that opened this campaign
  5. Link Clicks – Total amount of link clicks for this campaign (including multiple link clicks by the same contact)
  6. Unique Link Clicks – Total amount of distinct (unique) links clicked for this campaign
  7. Subscriber Clicks – Total amount of distinct (unique) contacts that clicked a link for this campaign
  8. Forwards – Total amount of forwards (via the %FORWARD2FRIEND% personalization link only) for this campaign (including multiple forwards initiated by the same contact)
  9. Unique Forwards – Total amount of distinct (unique) contacts that forwarded this campaign (via the %FORWARD2FRIEND% personalization link only)
  10. Hard Bounces – Total number of hard bounces for this campaign
  11. Soft Bounces – Total number of soft bounces for this campaign
  12. Unsubscribes – Total number of unsubscribes for this campaign
  13. Unsubscribe Reasons – Total number of unsubscribe reasons provided for unsubscriptions for this campaign
  14. Updates – Total number of contacts that updated their profile via this campaign (using the %UPDATELINK% personalization tag)
  15. Social Shares – Total number of social shares conducted for this campaign
  16. Replies – Total number of replies for this campaign (including multiple replies by the same contact)
  17. Unique Replies – Total number of distinct (unique) contacts that replied to this campaign
  18. Active RSS Items – The number of RSS items to display in the campaign
  19. Messages Count – Total number of messages used for the campaign
  20. Number of Records 

Templates

Instead of starting from scratch when building a chart, you can use a pre-built visualization. Simply click one of the templates from the list and it will be added to the dashboard filled with your data. You can then edit and customize this template like a usual chart created by you.

The following templates available for this dataset:

  • Automation Engagement (last 30 days) – View opens, clicks, and replies for your campaigns in your account over the last 30 days.
  • Campaign Engagement (last 30 days) – View open, click, and reply rates for your campaigns sent over the last 30 days.
  • Unsubscribe Rate (last 30 days) – View your unsubscribe rate over the last 30 days.

The Contacts data source contains information about your contacts such as bounce rate and applied tags.

Dimensions

  1. Contact Name – The name of the contact
  2. Subscribe Date – Date subscribed
  3. Unsubscribe Date – Date unsubscribed
  4. Status – The status of the contact
  5. Unsubscribe Reason – Unsubscribe reason
  6. Created At – Date the contact was initially created
  7. Bounced Date – Date of most recent bounce for this contact
  8. Organization Name – Name of the contact’s organization
  9. Tags – Tags assigned to contact
  10. List Names – Names of lists for this contact
  11. Rating – The rating for this contact
  12. Country – The country

Measures

  1. Hard Bounces – Number of times this contact has hard-bounced
  2. Soft Bounces – Number of times this contact has soft-bounced
  3. Contacts Count – Contacts Count

Templates

Instead of starting from scratch when building a chart, you can use a pre-built visualization. Simply click one of the templates from the list and it will be added to the dashboard filled with your data. You can then edit and customize this template like a usual chart created by you.

The following templates available for this dataset:

  • Number of Contacts by Country (last 30 days) – Track the number of contacts from different countries created over the last 30 days.
  • Number of Subscribers over the last 30 days – Track the number of subscribers in your ActiveCampaign account and see how this is trending over time.

This data source contains information about on the number of contacts subscribed via ActiveCampaign subscription forms.

Dimensions

  1. Form Name – The name of the form

Measures

  1. Subscriptions Count – The number of contacts subscribed via ActiveCampaign subscription forms
  2. Forms Count – Forms Count

Templates

Instead of starting from scratch when building a chart, you can use a pre-built visualization. Simply click one of the templates from the list and it will be added to the dashboard filled with your data. You can then edit and customize this template like a usual chart created by you.

The following templates available for this dataset:

  • Form Performance – View the number of sign ups from forms.

This data source contains information about on the number of tags applied to your contacts.

Dimensions

  1. Tag Name – The name of the tag

Measures

  1. Contact Count – The number of contacts using the Tag
  2. Tag Count – Number of times this contact was applied

Templates

Instead of starting from scratch when building a chart, you can use a pre-built visualization. Simply click one of the templates from the list and it will be added to the dashboard filled with your data. You can then edit and customize this template like a usual chart created by you.

The following templates available for this dataset:

  • Contacts Growth – This is the number of tags applied to your contacts.

This data source contains information about your deals.

Dimensions

  1. Primary Contact – The email of the primary contact
  2. Title – The title of the deal
  3. Created At – Date the deal was initially created
  4. ID – The unique identifier of the deal
  5. Updated At – Date the deal was updated last time
  6. Stage – The name of the current sequential stage
  7. Pipeline – The name of pipeline for this deal
  8. Organization Name – The names of the organizations that linked with this deal
  9. Owner Name – The name of the user who owner of this deal
  10. Currency – The currency for this deal
  11. Status – The status of the deal
  12. Next Date – Next date of activity for this deal

Measures

  1. Amount – Total worth for this deal
  2. Activity Count – The number of total activities associated with the deal
  3. Percent – The number from 1 to 100 representing the probability of winning for this deal
  4. Primary Contact (Distinct count) – Contact (Distinct count)
  5. Owner Name (Distinct count) – Owner Name (Distinct count)
  6. Deals Count – Deals Count

Creating a Chart

Click a dataset or integration and select Create dashboard/Create saved chart/Create presentation to start building a chart (please note that presentations are available starting from the Standard Plan).

From the next page, you can choose to create your own chart from scratch, or you can apply one of the templates we created.

  • If you choose to build a new chart from scratch (“Blank” option), the Chart designer will open. Go here to learn how to create a chart in the Chart designer.
  • If you choose a template, a new chart will be added to a dashboard/saved chart/presentation (depending on the way you start the chart creation).
Was this article helpful?
Dislike 0
Views: 335