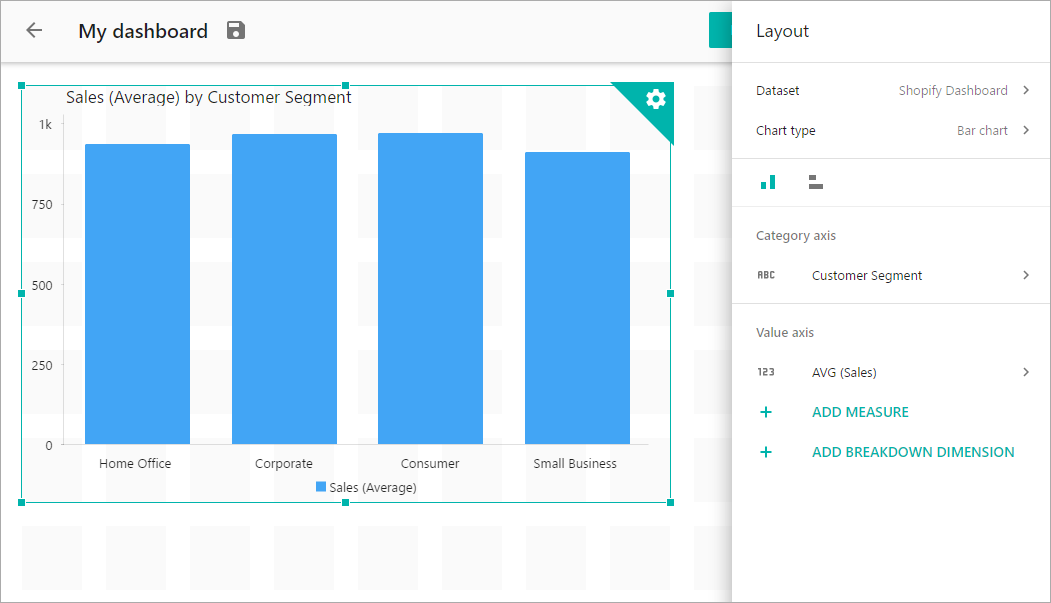
Aggregation functions perform a calculation on a data and return an individual value based on a set of values.
It is helpful when you need to represent an individual value to describe you analysis results. For example, if you have a 500 sales transactions from 10 products, you might want to get a sum of sales for each product to find out what product is more relevant to produce.
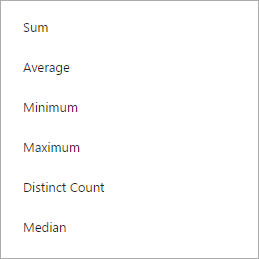
When adding a measure that contains numerical values (Number type of a column) you are able to aggregate the values with one of the following ways:
| Aggregation function | Description | Result for measure contains values
3, 5, 6, 5, 7 |
| Sum (SUM) | Values are summed up, the total value is displayed. | 26 |
| Average (AVG) | Values are summed up and divided by the number of values. Average value is displayed. | 5,2 |
| Minimum (MIN) | Minimum value is displayed. | 3 |
| Maximum (MAX) | Maximum value is displayed. | 7 |
| Distinct count (DCOUNT) | The number of unique values is counted and displayed. | 4 |
| Median (MEDIAN) | Values are sorted ascendingly, the middle value of the ordered row is displayed. | 5 |
For all of the aggregations (excepting SUM) a type of aggregation is represented in a chart.