

Zendesk Sell (previous name Base CRM) is a simple but powerful CRM with a seamless mobile experience.
- How to connect my Zendesk Sell account with Slemma?
- How to get data from Zendesk Sell?
- How to create a chart on my Zendesk Sell integration?
Creating an Integration
From your Slemma account, head over to the Library page and click the plus button at the bottom right. Select Integration from the submenu.
In the following page, you can find Zendesk Sell with one of the following ways:
- Scroll down and select Zendesk Sell from the list of Integrations.
- Use search to find Zendesk Sell from the list of Integrations.
- Choose Zendesk Sell using All dropdown list > CRM.
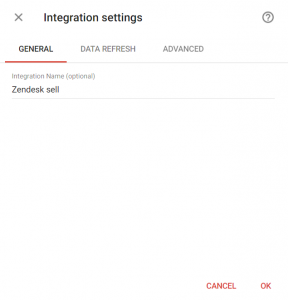
You’ll see the Integration settings dialog window. You can select the frequency for the automatic updates on the DATA REFRESH tab, or set weeks settings on the ADVANCED tab. Click OK.
You’ll be directed to a page to sign in. Login to your Zendesk Sell account and grant Slemma permission to access your data.
After authorization, the integration will be created and it will appear in your account in the list of objects. Now you are able to share the integration with either individuals or the entire Team, rename or remove the integration. To view the options available for the integration, right click it in the list.
Creating a Dataset
A dataset is a collection of data in a tabular format that is created on one of the possible data sources. The datasets can be used to create dashboards or individual charts.
To create a dataset, click your Zendesk Sell integration in the list and select Browse datasets. From the following page, select which data you want to add to use in your charts.
NOTE: Cloud Service Integrations have prebuilt datasets that are not editable.
Click dataset’s name for a description of each dataset.
This data source contains information about all of your contacts such as how many customers by industry and your custom fields.
- Contact Name – The full name of the contact
- Email – The email address of the contact
- Job Title – The contact’s job title
- Created At – Date the contact was initially created
- Customer Status – The customer status of the contact. Possible values: none, current, past
- Prospect Status – The prospect status of the contact. Possible values: none, current, past
- Created By – The user that created this contact
- Industry – The contact’s industry
- Twitter Handle – The contact’s Twitter handle
- Facebook Nickname – The contact’s Facebook nickname
- Linkedin Nickname – The contact’s Linkedin nickname
- Skype Nickname – The contact’s Skype nickname
- Tags – Tags for the contact
- Country – The country of the contact
- Website – The contact’s website address
- Owner – The user the contact is currently assigned to
- Custom Fields
- Contacts Count – Contacts Count
- Custom Fields
Templates
- Cumulative Number of Contacts Created over the last 30 days
- Number of Contacts by Industry
- Number of Contacts Created by Country (last 30 days)
This data source contains information about your leads such as your lead count by source. A lead represents an individual or an organization that expresses interest in your goods or services.
- Contact Name – The full name of the lead
- Email – The email address of the lead
- Title – Job title of the lead
- Created At – Date the lead was initially created
- Organization Name – Organization name of the lead
- Status – The status of the lead
- Source Name – The source name of lead
- Created By – The user that created this lead
- Industry – Organization’s industry
- Twitter Handle – Lead’s Twitter handle
- Facebook Nickname – Lead’s Facebook nickname
- Linkedin Nickname – Lead’s Linkedin nickname
- Skype Nickname – Lead’s Skype nickname
- Tags – Tags for the lead
- Country – The country of the lead
- Website – Lead’s website address
- Owner – The user who currently owns the lead
- Custom Fields
- Leads Count – Leads Count
Templates
- Leads by Status (last 6 months)
This data source contains information about all your tasks such as task count by due date, owner and more.
- Resource Type – Name of the resource type the task is attached to. Possible values: Lead, Contact, Deal
- Is Completed – Indicator of whether the task is completed or not
- Completed At – Date of the task’s completion
- Overdue – Indicator for whether the task has passed the due date or not
- Due Date – Date when the task should be completed
- Related To – The name of object that related to this task
- Created By – The user that created this task
- Created At – Date the task was initially created
- Owner – The user the task is assigned to
- Title – The title of the task
- Task Count – Task Count
Templates
- Number of Tasks Created by Username (last 30 days)
- Number of Tasks Created over the last 30 days
- Overdue Rate (last 30 days)
- Started vs. Completed Number of Tasks (last 30 days)
This data source contains information about all your deals such as value in a specific currency and deals count by current stage.
- Deal Name – The name of the deal
- Currency – The venue for the event
- Created At – Date the deal was initially created
- Hot – Indicator of whether or not the deal is hot
- Current Stage – The deal’s current stage in the pipeline
- Category Stage – The deal’s category stage in the pipeline
- Last Change Stage At – Date when the deal was moved into the current stage
- User Change Stage – The user who moved the deal into the current stage
- Last Activity At – Date of the last activity on the deal
- Created By – The user that created this deal
- Source – The source of the deal
- Loss Reason – Reason why the deal was lost
- Contact – The name of a primary contact
- Organization Name – The name of the organization
- Estimated Close Date – Estimated close date of the deal
- Tags – Tags for a deal
- Owner – The user the deal is assigned to
- Custom Field
- Value – Value of the deal in a currency specified in the currency field
- Deals Count – Deals Count
- Custom Fields
Templates
- Deals by Status (last 6 months)
- Number vs. Value of Deals by Source (last 30 days)
- Top 10 Contacts be Value of Deals (last 6 months)
Creating a Chart
Click a dataset or integration and select Create dashboard/Create saved chart/Create presentation to start building a chart (please note that presentations are available starting from the Standard Plan).
From the next page, you can choose to create your own chart from scratch, or you can apply one of the templates we created.
- If you choose to build a new chart from scratch (“Blank” option), the Chart designer will open. Go here to learn how to create a chart in the Chart designer.
- If you choose a template, a new chart will be added to a dashboard/saved chart/presentation (depending on the way you start the chart creation).