

Here we will discuss everything you should know to add a Google Map with latitudinal and longitudinal data to your dashboard.
The first thing is to make sure that your longitude and latitude data are both in separate columns. No special formatting is needed in these columns, they just have to be separated.
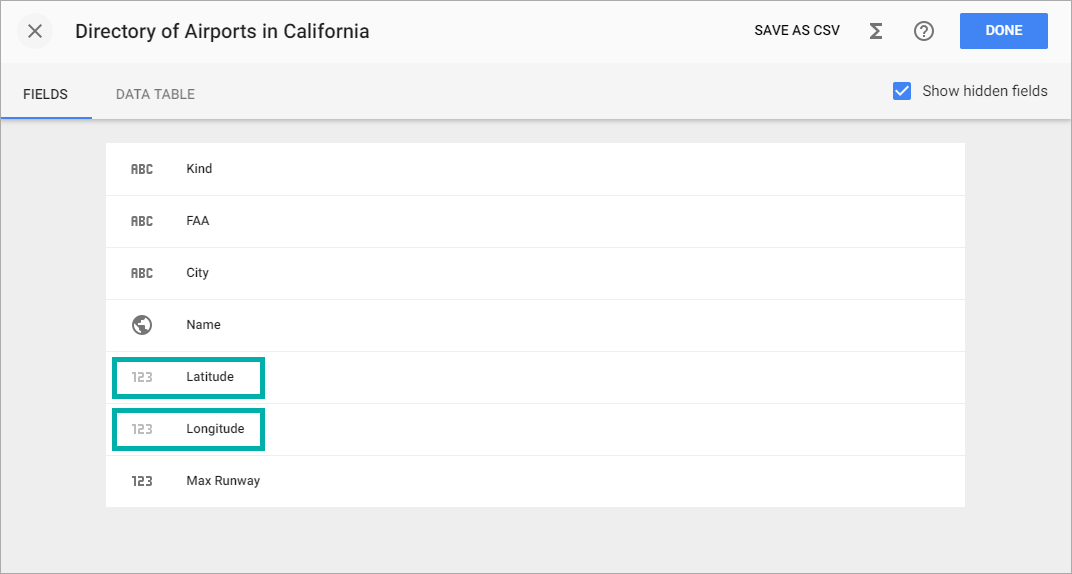
Next, choose a field that will act as your Geography dimension. Each point on the map requires an element in a dimension, just like each bubble requires its own member in a bubble chart. Each element in the Geography dimension will get a plot on the map. Select this field and use the Type dropdown to set the field type to Geography.

The second dropdown which appears under Type allows to choose the map type. Select Google Map. Two more options will appear for you to specify which of your columns contain the latitude and longitude data.

Once you have gotten to the chart editing view, place your geography dimension into the locations box (if Slemma does not do it for you). Then you should be able to place the metrics you wish to visualize color or size.
