

Facebook Ads drive your online sales, promote your app and increases brand awareness. With Slemma, you can build a custom Facebook Ads dashboard to monitor your campaigns and ensure their continued success. Measure your campaigns like never before with a real-time social media dashboard.
In this article, you’ll find the answers to the following questions:
- How to connect my Facebook Ads account with Slemma?
- How to get data from Facebook Ads?
- How to create a chart on my Facebook Ads integration?
Slemma currently supports Facebook Ads API version 7.0.
Creating an Integration
To create an integration, head over to the Library tab (your home page) and click the plus button at the bottom right. Select Integration from the submenu.
In the next page, scroll down (or use Search) and select Facebook Ads from the list.
You’ll see the Integration settings dialog window. You can select the frequency for the automatic updates on the DATA REFRESH tab, or set weeks settings on the ADVANCED tab. Click OK for now.
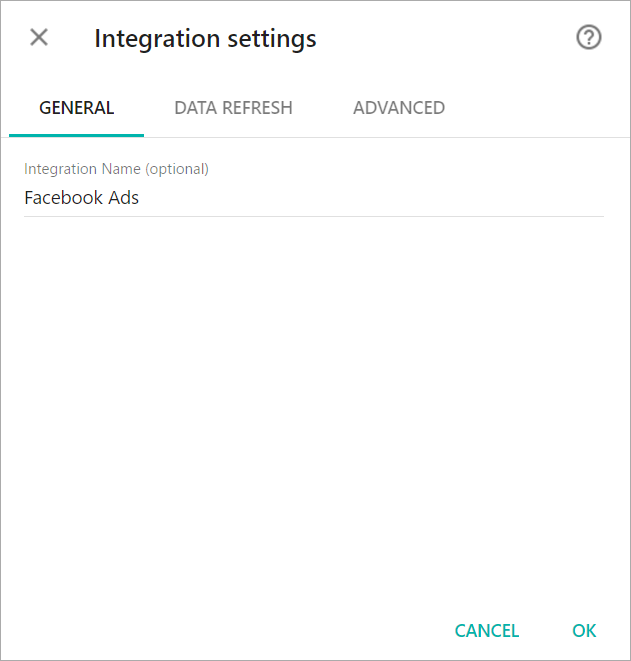
You’ll be directed to a page to sign in. Login to your Facebook account.
After authorization, the integration will be created and it will appear in your account in the list of objects. Now you are able to share the integration with either individuals or the entire Team, rename or remove the integration. To view the options available for the integration, right click it in the list.
Creating a Dataset
A dataset is a collection of data in a tabular format that is created on one of the possible data sources. The datasets can be used to create dashboards or individual charts.
To create a dataset, click your Facebook Ads integration in the list and select Create dataset.
Cloud Service integrations have prebuilt datasets that are not editable.
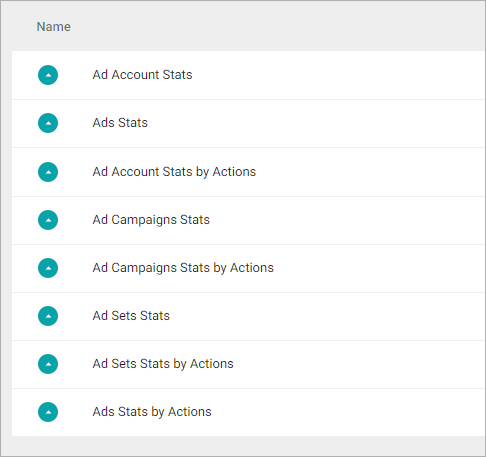
Click dataset’s name for a description of each dataset.
This data source contains insights on the advertising performance of your ad accounts such as average.
Dimensions
- Date Start – The start date for your data
- Created – Created time
- Account Name – Name of the ad account and name of business profile (if applicable). If the account name is not set, the name of the first admin visible to the user will be returned
- Business Country – Country code for the business address
- Status – Status of the account
- Placement – Placement is where your ad is shown on Facebook such as on News Feed on desktop, News Feed on a mobile device or on the right column
- Business Name – The name of business account
Measures
- Store Clicks – The numbers of clicks that go to app store after user clicks your ads
- Call to Action Clicks – The number of clicks on the call to action button your ad receives
- Avg View, % – The average percentage of the Canvas seen
- Avg View Time, sec – The average time spent in seconds, within a Canvas unit
- Total Clicks – The total number of clicks on your ad. Depending on what you’re promoting, this can include Page likes, event responses or app installs
- Per 10 sec View Video – The average cost per 10-second video view, calculated as the amount spent divided by the number of 10-second video views
- Estimated Ad Recall Lift (People) – The average cost per additional person we estimate will recall seeing your ad if asked within 2 days
- Per Inline Link Click – The average you paid for each inline link click
- Per Inline Post Engagement – The average you paid for each inline post engagement
- Per Total Action – The average you’ve spent on actions. For example, if you spent $20 and you got 10 Page likes, each one cost an average of $2
- Per Unique Click – The average cost per unique click for these ads, calculated as the amount spent divided by the number of unique clicks received
- Per Unique Click (Inline Link) – The average you paid for each unique inline link click
- CPC – The average cost per click for these ads, calculated as the amount spent divided by the number of clicks received
- CPM – The average cost you’ve paid to have 1,000 impressions on your ad
- CPP – The average cost you’ve paid to have your ad served to 1,000 unique people
- CTR – The number of clicks you received divided by the number of impressions
- Deeplink Clicks – The numbers of clicks that go to app after user clicks your ads
- Estimated Ad Recall Lift Rate – The estimated number of people who recall your ad divided by the number of people your ad reached
- Estimated Ad Recall Lift (People) – The additional number of people we estimate will remember seeing your ads if asked within 2 days
- Frequency – The average number of times your ad was served to each person
- Total Impressions – The number of times your ad was served. On our mobile apps an ad is counted as served the first time it’s viewed. On all other Facebook interfaces, an ad is served the first time it’s placed in a person’s News Feed or each time it’s placed in the right column
- CTR (Link) – Click-through rate for inline clicks to link
- Total Inline Link Clicks – The number of inline link clicks that your ad got
- Inline Post Engagement – The number of inline post engagement that your ad got
- Newsfeed Position – The average position where your ad was inserted into people’s news feeds on mobile and desktop. Position 1 is the one at the top of the feed
- Newsfeed Clicks – The total number of clicks your ad received in people’s news feed, on mobile and desktop
- Newsfeed Impressions – The total number of times your ad was inserted into people’s news feeds, on mobile and desktop
- Reach – The number of people your ad was served to. This is the same as unique_impressions
- Relevance Score – Ad relevance score is multiple metrics related to how your audience responded to your ad. Only available at ad level and will not be returned for aggregations at other levels
- Social Clicks – The number of clicks your ad receives when it’s shown with social information (ex: Jane Doe likes this)
- Social Impressions – The number of times your ad was served, with social information. For example, if 3 people are served an ad 2 times each and it includes information about a friend liking your Page, it counts as 6 social impressions
- Social Reach – The number of people your ad was served to with social information. For example, if 3 people see an ad 2 times each that says a friend likes your Page, it counts as 3 social reache
- Social Spend – The total amount you’ve spent so far for your ads showed with social information. (ex: Jane Doe likes this)
- Spend – The total amount you’ve spent so far
- Total Revenue – The total revenue returned from conversions or Facebook credit spends
- Total Actions – The number of actions taken on your ad, Page, app or event after your ad was served to someone, even if they didn’t click on it. Actions include Page likes, app installs, conversions, event responses and more. For example, 2 Page likes and 2 comments would be counted as 4 action
- Total Unique Actions – The number of people who took an action that was attributed to your ads
- Unique Clicks – The total number of unique people who have clicked on your ad. For example, if 3 people click on the same ad 5 times, it will count as 3 unique clicks
- Unique CTR – The number of people who clicked on your ad divided by the number of people you reached. For example, if you received 20 unique clicks and your ad was served to 1,000 unique people, your unique click-through rate would be 2%
- Unique Impressions – The number of individuals the ad was served to on the site. This is the same as reach
- Unique CTR (Inline Link) – Click-through rate for unique inline clicks to link
- Unique Inline Link Clicks – The number of unique inline link clicks that your ad got
- Unique CTR (Link) – Unique click-through rate for clicks to link. The number of people who clicked on the link in your ad that directs people off Facebook divided by the number of people you reached. Example: if you received 20 unique clicks to link and your ad was shown to 1,000 unique people, your unique click-through rate would be 2%
- Unique Social Clicks – The number of individuals who clicked this ad while it had social context
- Unique Social Impressions – The number of people the ad was served to with social context
- Website Clicks – The numbers of clicks that go to web after user clicks your ads
- CTR (Product) – The number of link clicks a product received divided by the number of impressions of the product, only applicable for multi-product ads
- Number of Records – Number of Records
Templates
- Ad accounts. Action Rate over the last 30 days – View your action rate for your ad accounts over time. Action rate is calculated as all actions divided by impressions.
- Ad accounts. Click-Through Rate over the last 30 days – View your click-through rates for ad accounts over time. CTR is calculated as all clicks divided by impressions.
- Ad accounts. Cost per Action over the last 30 days – View your cost per action over time. Cost per Action is calculated as amount spent divided by number of actions for ad accounts.
- Ad accounts. Cost per Click over the last 30 days – View your cost per click over time. CPC is calculated as amount spent divided by number of clicks for ad accounts.
- Ad accounts. Frequency over the last 30 days – View the average number of times your ad accounts were served to each person.
- Ad accounts. Reach over the last 30 days – View the number of people who see your ad accounts in a given time period and how it trends.
This data source contains insights on the advertising performance of your ad accounts by action type.
Dimensions
- Date Start – The start date for your data
- Created – Created time
- Account Name – Name of the ad account and name of business profile (if applicable). If the account name is not set, the name of the first admin visible to the user will be returned
- Business Country – Country code for the business address
- Action Type – Type of Action
- Status – Status of the account
- Business Name – The name of business account
Measures
- Action Values – The total revenue returned from conversions or Facebook credit spends
- Actions Count – The number of actions taken on your ad, Page, app or event after your ad was served to someone, even if they didn’t click on it. Actions include Page likes, app installs, conversions, event responses and more. For example, 2 Page likes and 2 comments would be counted as 4 actions
- Per Action Type – The average you’ve spent on actions. For example, if you spent $20 and you got 10 Page likes, each one cost an average of $2
- Per Unique Action Type – The average you paid for each type of unique action
- Unique Actions – The number of unique people who took an action such as liking your Page or installing your app as a result of your ad. For example, if the same person likes and comments on a post, they will be counted as 1 unique person
- CTR (Product) – The number of link clicks a product received divided by the number of impressions of the product, only applicable for multi-product ads
- Total Views Video (10 sec) – This shows the number of total views of at least 10 seconds or to the end of your video, whichever occurs first
- Total Views Video (15 sec) – The number of times your video was viewed more than 15 seconds, including views that skipped to this point
- Total Views Video (30 sec) – This shows the number of total views of at least 30 seconds or to the end of your video, whichever occurs first
- Audience Retention – This is the total video watch time divided by views of your video over your video’s duration. This is not applicable for live videos
- Video Percentage Watched – not supported by Facebook API 4.0
- Video Average Watch Time – This is the total video watch time for your video divided by the total number of plays of your video
- Total Views Video (Complete) – This shows the number of total views of at least 30 seconds or to the end of your video, whichever occurs first
- Total Views (100%) – The number of times your video was viewed to 100% of its length, including views that skipped to this point
- Total Views (25%) – The number of times your video was viewed to 25% of its length, including views that skipped to this point
- Total Views (50%) – The number of times your video was viewed to 50% of its length, including views that skipped to this point
- Total Views (75%) – The number of times your video was viewed to 75% of its length, including views that skipped to this point
- Total Views (95%) – not supported by Facebook API 4.0
- Number of Records – Number of Records
Templates
- Ad Accounts. Number of Actions over the last 30 days – View the total number of actions people took that are attributed to your ad accounts. Actions may include engagement, clicks or conversions.
This data source contains insights on the advertising performance of your ad campaigns for your ad accounts.
Dimensions
- Date Start – The start date for your data
- Created – Created time
- Configure Status – The configured status of the campaign
- Account Name – Name of the ad account and name of business profile (if applicable). If the account name is not set, the name of the first admin visible to the user will be returned
- Business Country – Country code for the business address
- Campaign Name – Name of the campaign
- Objective – The objective you selected for your ad, ad set, or campaign. Your objective reflects what you want to achieve with ads
- Account Status – Status of the account
- Placement – Placement is where your ad is shown on Facebook such as on News Feed on desktop, News Feed on a mobile device or on the right column
- Status – Status of the campaign
- Tags – Tags associated with this campaign
- Business Name – The name of business account
Measures
- Store Clicks – The numbers of clicks that go to app store after user clicks your ads
- Call to Action Clicks – The number of clicks on the call to action button your ad receives
- Avg View, % – The average percentage of the Canvas seen
- Avg View Time, sec – The average time spent in seconds, within a Canvas unit
- Total Clicks – The total number of clicks on your ad. Depending on what you’re promoting, this can include Page likes, event responses or app installs
- Per 10 sec View Video – The average cost per 10-second video view, calculated as the amount spent divided by the number of 10-second video views
- Estimated Ad Recall Lift (People) – The average cost per additional person we estimate will recall seeing your ad if asked within 2 days
- Per Inline Link Click – The average you paid for each inline link click
- Per Inline Post Engagement – The average you paid for each inline post engagement
- Per Total Action – The average you’ve spent on actions. For example, if you spent $20 and you got 10 Page likes, each one cost an average of $2
- Per Unique Click – The average cost per unique click for these ads, calculated as the amount spent divided by the number of unique clicks received
- Per Unique Click (Inline Link) – The average you paid for each unique inline link click
- CPC – The average cost per click for these ads, calculated as the amount spent divided by the number of clicks received
- CPM – The average cost you’ve paid to have 1,000 impressions on your ad
- CPP – The average cost you’ve paid to have your ad served to 1,000 unique people
- CTR – The number of clicks you received divided by the number of impressions
- Deeplink Clicks – The numbers of clicks that go to app after user clicks your ads
- Estimated Ad Recall Lift Rate – The estimated number of people who recall your ad divided by the number of people your ad reached
- Estimated Ad Recall Lift (People) – The additional number of people we estimate will remember seeing your ads if asked within 2 days
- Frequency – The average number of times your ad was served to each person
- Total Impressions – The number of times your ad was served. On our mobile apps an ad is counted as served the first time it’s viewed. On all other Facebook interfaces, an ad is served the first time it’s placed in a person’s News Feed or each time it’s placed in the right column
- CTR (Link) – Click-through rate for inline clicks to link
- Total Inline Link Clicks – The number of inline link clicks that your ad got
- Inline Post Engagement – The number of inline post engagement that your ad got
- Newsfeed Position – The average position where your ad was inserted into people’s news feeds on mobile and desktop. Position 1 is the one at the top of the feed
- Newsfeed Clicks – The total number of clicks your ad received in people’s news feed, on mobile and desktop
- Newsfeed Impressions – The total number of times your ad was inserted into people’s news feeds, on mobile and desktop
- Reach – The number of people your ad was served to. This is the same as unique_impressions
- Relevance Score – Ad relevance score is multiple metrics related to how your audience responded to your ad. Only available at ad level and will not be returned for aggregations at other levels
- Social Clicks – The number of clicks your ad receives when it’s shown with social information (ex: Jane Doe likes this)
- Social Impressions – The number of times your ad was served, with social information. For example, if 3 people are served an ad 2 times each and it includes information about a friend liking your Page, it counts as 6 social impressions
- Social Reach – The number of people your ad was served to with social information. For example, if 3 people see an ad 2 times each that says a friend likes your Page, it counts as 3 social reache
- Social Spend – The total amount you’ve spent so far for your ads showed with social information. (ex: Jane Doe likes this)
- Spend – The total amount you’ve spent so far
- Total Revenue – The total revenue returned from conversions or Facebook credit spends
- Total Actions – The number of actions taken on your ad, Page, app or event after your ad was served to someone, even if they didn’t click on it. Actions include Page likes, app installs, conversions, event responses and more. For example, 2 Page likes and 2 comments would be counted as 4 action
- Unique Clicks – The total number of unique people who have clicked on your ad. For example, if 3 people click on the same ad 5 times, it will count as 3 unique clicks
- Unique CTR – The number of people who clicked on your ad divided by the number of people you reached. For example, if you received 20 unique clicks and your ad was served to 1,000 unique people, your unique click-through rate would be 2%
- Unique Impressions – The number of individuals the ad was served to on the site. This is the same as reach
- Unique CTR (inline Link) – Click-through rate for unique inline clicks to link
- Unique Inline Link Clicks – The number of unique inline link clicks that your ad got
- Unique CTR (Link) – Unique click-through rate for clicks to link. The number of people who clicked on the link in your ad that directs people off Facebook divided by the number of people you reached. Example: if you received 20 unique clicks to link and your ad was shown to 1,000 unique people, your unique click-through rate would be 2%
- Unique Social Clicks – The number of individuals who clicked this ad while it had social context
- Unique Social Impressions – The number of people the ad was served to with social context
- Website Clicks – The numbers of clicks that go to web after user clicks your ads
- CTR (Product) – The number of link clicks a product received divided by the number of impressions of the product, only applicable for multi-product ads
- Number of Records – Number of Records
Templates
- Ad Campaigns. Action Rate over the last 30 days – View your action rate for your ad campaigns over time. Action rate is calculated as all actions divided by impressions.
- Ad Campaigns. Click-Through Rate over the last 30 days – View your click-through rates for ad campaigns over time. CTR is calculated as all clicks divided by impressions.
- Ad Campaigns. Cost per Click over the last 30 days – View your cost per click over time. CPC is calculated as amount spent divided by number of clicks for ad campaigns.
- Ad Campaigns. Frequency over the last 30 days – View the average number of times your ad campaigns were served to each person.
- Ad Campaigns. Number of Clicks over the last 30 days – View the total number of clicks on your ad campaigns over time. Depending on what you’re promoting, this can include Page likes, event responses or app installs.
- Ad Campaigns. Reach over the last 30 days – View the number of people who see your ad campaigns in a given time period and how it trends.
- Ad Campaigns. Cost per Action over the last 30 days – View your cost per action over time. Cost per Action is calculated as amount spent divided by number of actions for ad campaigns.
This data source contains insights on the advertising performance of ad campaigns by action type.
Dimensions
- Date Start – The start date for your data
- Campaign Name – Name of the campaign
- Created – Created time
- Configure Status – The configured status of the campaign
- Account Name – Name of the ad account and name of business profile (if applicable). If the account name is not set, the name of the first admin visible to the user will be returned
- Business Country – Country code for the business address
- Objective – The objective you selected for your ad, ad set, or campaign. Your objective reflects what you want to achieve with ads
- Account Status – Status of the account
- Action Type – Type of Action
- Status – Status of the campaign
- Tags – Tags associated with this campaign
- Business Name – The name of business account
Measures
- Action Values – The total revenue returned from conversions or Facebook credit spends
- Actions Count – The number of actions taken on your ad, Page, app or event after your ad was served to someone, even if they didn’t click on it. Actions include Page likes, app installs, conversions, event responses and more. For example, 2 Page likes and 2 comments would be counted as 4 actions
- Per Action Type – The average you’ve spent on actions. For example, if you spent $20 and you got 10 Page likes, each one cost an average of $2
- Per Unique Action Type – The average you paid for each type of unique action
- Unique Actions – The number of unique people who took an action such as liking your Page or installing your app as a result of your ad. For example, if the same person likes and comments on a post, they will be counted as 1 unique person
- CTR (Product) – The number of link clicks a product received divided by the number of impressions of the product, only applicable for multi-product ads
- Total Views Video (10 sec) – This shows the number of total views of at least 10 seconds or to the end of your video, whichever occurs first
- Total Views Video (15 sec) – The number of times your video was viewed more than 15 seconds, including views that skipped to this point
- Total Views Video (30 sec) – This shows the number of total views of at least 30 seconds or to the end of your video, whichever occurs first
- Audience Retention – This is the total video watch time divided by views of your video over your video’s duration. This is not applicable for live videos
- Video Percentage Watched – not supported by Facebook API 4.0
- Video Average Watch Time – This is the total video watch time for your video divided by the total number of plays of your video
- Total Views Video (Complete) – This shows the number of total views of at least 30 seconds or to the end of your video, whichever occurs first
- Total Views (100%) – The number of times your video was viewed to 100% of its length, including views that skipped to this point
- Total Views (25%) – The number of times your video was viewed to 25% of its length, including views that skipped to this point
- Total Views (50%) – The number of times your video was viewed to 50% of its length, including views that skipped to this point
- Total Views (75%) – The number of times your video was viewed to 75% of its length, including views that skipped to this point
- Total Views (95%) – not supported by Facebook API 4.0
- Number of Records – Number of Records
Templates
- Ad Campaigns. Number of Actions over the last 30 days – View the total number of actions people took that are attributed to your ad campaigns. Actions may include engagement, clicks or conversions.
This data source contains insights on the advertising performance of your ad sets for ad accounts.
Dimensions
- Date Start – The start date for your data
- Created – Created time
- Configure Status – The configured status of the campaign
- Account Name – Name of the account. If the account name is not set, the name of the first admin visible to the user will be returned
- Business Country – Country code for the business address
- Ad Set Name – Name of the ad set
- Objective – The objective you selected for your ad, ad set, or campaign. Your objective reflects what you want to achieve with ads
- Account Status – Status of the account
- Status – Status of the ad set
- Tags – Tags associated with this campaign
- Business Name – The name of business account
Measures
- Call to Action Clicks – The number of clicks on the call to action button your ad receives
- Avg View, % – The average percentage of the Canvas seen
- Avg View Time, sec – The average time spent in seconds, within a Canvas unit
- Total Clicks – The total number of clicks on your ad. Depending on what you’re promoting, this can include Page likes, event responses or app installs
- Per 10 sec View Video – The average cost per 10-second video view, calculated as the amount spent divided by the number of 10-second video views
- Estimated Ad Recall Lift (People) – The average cost per additional person we estimate will recall seeing your ad if asked within 2 days
- Per Inline Link Click – The average you paid for each inline link click
- Per Inline Post Engagement – The average you paid for each inline post engagement
- Per Total Action – The average you’ve spent on actions. For example, if you spent $20 and you got 10 Page likes, each one cost an average of $2
- Per Unique Click – The average cost per unique click for these ads, calculated as the amount spent divided by the number of unique clicks received
- Per Unique Click (Inline Link) – The average you paid for each unique inline link click
- CPC – The average cost per click for these ads, calculated as the amount spent divided by the number of clicks received
- CPM – The average cost you’ve paid to have 1,000 impressions on your ad
- CPP – The average cost you’ve paid to have your ad served to 1,000 unique people
- CTR – The number of clicks you received divided by the number of impressions
- Estimated Ad Recall Lift Rate – The estimated number of people who recall your ad divided by the number of people your ad reached
- Estimated Ad Recall Lift (People) – The additional number of people we estimate will remember seeing your ads if asked within 2 days
- Frequency – The average number of times your ad was served to each person
- Total Impressions – The number of times your ad was served. On our mobile apps an ad is counted as served the first time it’s viewed. On all other Facebook interfaces, an ad is served the first time it’s placed in a person’s News Feed or each time it’s placed in the right column
- CTR (Link) – Click-through rate for inline clicks to link
- Total Inline Link Clicks – The number of inline link clicks that your ad got
- Inline Post Engagement – The number of inline post engagement that your ad got
- Reach – The number of people your ad was served to. This is the same as unique_impressions
- Relevance Score – Ad relevance score is multiple metrics related to how your audience responded to your ad. Only available at ad level and will not be returned for aggregations at other levels
- Social Clicks – The number of clicks your ad receives when it’s shown with social information (ex: Jane Doe likes this)
- Social Impressions – The number of times your ad was served, with social information. For example, if 3 people are served an ad 2 times each and it includes information about a friend liking your Page, it counts as 6 social impressions
- Social Reach – The number of people your ad was served to with social information. For example, if 3 people see an ad 2 times each that says a friend likes your Page, it counts as 3 social reache
- Social Spend – The total amount you’ve spent so far for your ads showed with social information. (ex: Jane Doe likes this)
- Spend – The total amount you’ve spent so far
- Total Revenue – The total revenue returned from conversions or Facebook credit spends
- Total Actions – The number of actions taken on your ad, Page, app or event after your ad was served to someone, even if they didn’t click on it. Actions include Page likes, app installs, conversions, event responses and more. For example, 2 Page likes and 2 comments would be counted as 4 action
- Unique Clicks – The total number of unique people who have clicked on your ad. For example, if 3 people click on the same ad 5 times, it will count as 3 unique clicks
- Unique CTR – The number of people who clicked on your ad divided by the number of people you reached. For example, if you received 20 unique clicks and your ad was served to 1,000 unique people, your unique click-through rate would be 2%
- Unique CTR (inline Link) – Click-through rate for unique inline clicks to link
- Unique Inline Link Clicks – The number of unique inline link clicks that your ad got
- Unique CTR (Link) – Unique click-through rate for clicks to link. The number of people who clicked on the link in your ad that directs people off Facebook divided by the number of people you reached. Example: if you received 20 unique clicks to link and your ad was shown to 1,000 unique people, your unique click-through rate would be 2%
- Unique Social Clicks – The number of individuals who clicked this ad while it had social context
- CTR (Product) – The number of link clicks a product received divided by the number of impressions of the product, only applicable for multi-product ads
- Number of Records – Number of Records
Templates
- Ad Sets. Action Rate over the last 30 days – View your action rate for your ad sets over time. Action rate is calculated as all actions divided by impressions.
- Ad Sets. Click-Through Rate over the last 30 days – View your click-through rates for ad sets over time. CTR is calculated as all clicks divided by impressions.
- Ad Sets. Cost per Click over the last 30 days – View your cost per click over time. CPC is calculated as amount spent divided by number of clicks for ad sets.
- Ad Sets. Frequency over the last 30 days – View the average number of times your ad sets were served to each person.
- Ad Sets. Number of Clicks over the last 30 days – View the total number of clicks on your ad sets over time. Depending on what you’re promoting, this can include Page likes, event responses or app installs.
- Ad Sets. Reach over the last 30 days – View the number of people who see your ad sets in a given time period and how it trends.
- Ad Sets. Cost per Action over the last 30 days – View your cost per action over time. Cost per Action is calculated as amount spent divided by number of actions for ad sets.
This data source contains insights on the advertising performance of ads by action type.
Dimensions
- Date Start – The start date for your data
- Created – Created time
- Ad Set Name – Name of the ad set
- Configure Status – The configured status of the ad set
- Account Name – Name of the ad account and name of business profile (if applicable). If the account name is not set, the name of the first admin visible to the user will be returned
- Business Country – Country code for the business address
- Objective – The objective you selected for your ad, ad set, or campaign. Your objective reflects what you want to achieve with ads
- Account Status – Status of the account
- Action Type – Type of Action
- Status – Status of the ad set
- Tags – Tags associated with this campaign
- Business Name – The name of business account
Measures
- Action Values – The total revenue returned from conversions or Facebook credit spends
- Actions Count – The number of actions taken on your ad, Page, app or event after your ad was served to someone, even if they didn’t click on it. Actions include Page likes, app installs, conversions, event responses and more. For example, 2 Page likes and 2 comments would be counted as 4 actions
- Per Action Type – The average you’ve spent on actions. For example, if you spent $20 and you got 10 Page likes, each one cost an average of $2
- Per Unique Action Type – The average you paid for each type of unique action
- Unique Actions – The number of unique people who took an action such as liking your Page or installing your app as a result of your ad. For example, if the same person likes and comments on a post, they will be counted as 1 unique person
- CTR (Product) – The number of link clicks a product received divided by the number of impressions of the product, only applicable for multi-product ads
- Total Views Video (10 sec) – This shows the number of total views of at least 10 seconds or to the end of your video, whichever occurs first
- Total Views Video (15 sec) – The number of times your video was viewed more than 15 seconds, including views that skipped to this point
- Total Views Video (30 sec) – This shows the number of total views of at least 30 seconds or to the end of your video, whichever occurs first
- Video Percentage Watched – not supported by Facebook API 4.0
- Video Average Watch Time – This is the total video watch time for your video divided by the total number of plays of your video
- Total Views (100%) – The number of times your video was viewed to 100% of its length, including views that skipped to this point
- Total Views (25%) – The number of times your video was viewed to 25% of its length, including views that skipped to this point
- Total Views (50%) – The number of times your video was viewed to 50% of its length, including views that skipped to this point
- Total Views (75%) – The number of times your video was viewed to 75% of its length, including views that skipped to this point
- Total Views (95%) – not supported by Facebook API 4.0
- Number of Records – Number of Records
Templates
- Ad Sets. Number of Actions over the last 30 days – View the total number of actions people took that are attributed to your ad sets. Actions may include engagement, clicks or conversions.
This data source contains insights on the advertising performance of ads for your ad accounts.
Dimensions
- Date Start – The start date for your data
- Ad Name – Name of the ad
- Created – Created time
- Bid Type – Bid type
- Configure Status – The configured status of the ad
- Account Name – Name of the ad account and name of business profile (if applicable). If the account name is not set, the name of the first admin visible to the user will be returned
- Business Country – Country code for the business address
- Adset Name – A group of ads that share the same budget and are usually about a single topic
- Campaign Name – A group of ad sets that share the same objective
- Objective – The objective you selected for your ad, ad set, or campaign. Your objective reflects what you want to achieve with ads
- Account Status – Status of the account
- Placement – Placement is where your ad is shown on Facebook such as on News Feed on desktop, News Feed on a mobile device or on the right column
- Status – Status of the ad
- Tags – Tags associated with this campaign
- Business Name – The name of business account
Measures
- Store Clicks – The numbers of clicks that go to app store after user clicks your ads
- Call to Action Clicks – The number of clicks on the call to action button your ad receives
- Avg View, % – The average percentage of the Canvas seen
- Avg View Time, sec – The average time spent in seconds, within a Canvas unit
- Total Clicks – The total number of clicks on your ad. Depending on what you’re promoting, this can include Page likes, event responses or app installs
- Per 10 sec View Video – The average cost per 10-second video view, calculated as the amount spent divided by the number of 10-second video views
- Estimated Ad Recall Lift (People) – The average cost per additional person we estimate will recall seeing your ad if asked within 2 days
- Per Inline Link Click – The average you paid for each inline link click
- Per Inline Post Engagement – The average you paid for each inline post engagement
- Per Total Action – The average you’ve spent on actions. For example, if you spent $20 and you got 10 Page likes, each one cost an average of $2
- Per Unique Click – The average cost per unique click for these ads, calculated as the amount spent divided by the number of unique clicks received
- Per Unique Click (Inline Link) – The average you paid for each unique inline link click
- CPC – The average cost per click for these ads, calculated as the amount spent divided by the number of clicks received
- CPM – The average cost you’ve paid to have 1,000 impressions on your ad
- CPP – The average cost you’ve paid to have your ad served to 1,000 unique people
- CTR – The number of clicks you received divided by the number of impressions
- Deeplink Clicks – The numbers of clicks that go to app after user clicks your ads
- Estimated Ad Recall Lift Rate – The estimated number of people who recall your ad divided by the number of people your ad reached
- Estimated Ad Recall Lift (People) – The additional number of people we estimate will remember seeing your ads if asked within 2 days
- Frequency – The average number of times your ad was served to each person
- Total Impressions – The number of times your ad was served. On our mobile apps an ad is counted as served the first time it’s viewed. On all other Facebook interfaces, an ad is served the first time it’s placed in a person’s News Feed or each time it’s placed in the right column
- CTR (Link) – Click-through rate for inline clicks to link
- Total Inline Link Clicks – The number of inline link clicks that your ad got
- Inline Post Engagement – The number of inline post engagement that your ad got
- Newsfeed Position – The average position where your ad was inserted into people’s news feeds on mobile and desktop. Position 1 is the one at the top of the feed
- Newsfeed Clicks – The total number of clicks your ad received in people’s news feed, on mobile and desktop
- Newsfeed Impressions – The total number of times your ad was inserted into people’s news feeds, on mobile and desktop
- Reach – The number of people your ad was served to. This is the same as unique_impressions
- Relevance Score – Ad relevance score is multiple metrics related to how your audience responded to your ad. Only available at ad level and will not be returned for aggregations at other levels
- Social Clicks – The number of clicks your ad receives when it’s shown with social information (ex: Jane Doe likes this)
- Social Impressions – The number of times your ad was served, with social information. For example, if 3 people are served an ad 2 times each and it includes information about a friend liking your Page, it counts as 6 social impressions
- Social Reach – The number of people your ad was served to with social information. For example, if 3 people see an ad 2 times each that says a friend likes your Page, it counts as 3 social reache
- Social Spend – The total amount you’ve spent so far for your ads showed with social information. (ex: Jane Doe likes this)
- Spend – The total amount you’ve spent so far
- Total Revenue – The total revenue returned from conversions or Facebook credit spends
- Total Actions – The number of actions taken on your ad, Page, app or event after your ad was served to someone, even if they didn’t click on it. Actions include Page likes, app installs, conversions, event responses and more. For example, 2 Page likes and 2 comments would be counted as 4 action
- Unique Clicks – The total number of unique people who have clicked on your ad. For example, if 3 people click on the same ad 5 times, it will count as 3 unique clicks
- Unique CTR – The number of people who clicked on your ad divided by the number of people you reached. For example, if you received 20 unique clicks and your ad was served to 1,000 unique people, your unique click-through rate would be 2%
- Unique Impressions – The number of individuals the ad was served to on the site. This is the same as reach
- Unique CTR (inline Link) – Click-through rate for unique inline clicks to link
- Unique Inline Link Clicks – The number of unique inline link clicks that your ad got
- Unique CTR (Link) – Unique click-through rate for clicks to link. The number of people who clicked on the link in your ad that directs people off Facebook divided by the number of people you reached. Example: if you received 20 unique clicks to link and your ad was shown to 1,000 unique people, your unique click-through rate would be 2%
- Unique Social Clicks – The number of individuals who clicked this ad while it had social context
- Unique Social Impressions – The number of people the ad was served to with social context
- Website Clicks – The numbers of clicks that go to web after user clicks your ads
- CTR (Product) – The number of link clicks a product received divided by the number of impressions of the product, only applicable for multi-product ads
- Number of Records – Number of Records
Templates
- Ads. Action Rate over the last 30 days – View your action rate for your ads over time. Action rate is calculated as all actions divided by impressions.
- Ads. Click-Through Rate over the last 30 days – View your click-through rates for ads over time. CTR is calculated as all clicks divided by impressions.
- Ads. Cost per Action over the last 30 days – View your cost per action over time. Cost per Action is calculated as amount spent divided by number of actions for ads.
- Ads. Cost per Click over the last 30 days – View your cost per click over time. CPC is calculated as amount spent divided by number of clicks for ads.
- Ads. Frequency over the last 30 days – View the average number of times your ads were served to each person.
- Ads. Number of Clicks over the last 30 days – View the total number of clicks on your ads over time. Depending on what you’re promoting, this can include Page likes, event responses or app installs.
- Ads. Number of Impressions over the last 30 days – View the number of times your ads were viewed over time.
- Ads. Reach over the last 30 days – View the number of people who see your ads in a given time period and how it trends.
- Highest Action Rate – View your top 10 ads that generated the highest actions rate. Action rate is calculated as all actions divided by impressions.
- Highest Click-Through Rate – View your top 10 ads that generated the highest click-through rate.
This data source contains insights on the advertising performance of ads by action type.
Dimensions
- Date Start – The start date for your data
- Ad Name – Name of the ad
- Created – Created time
- Bid Type – Bid type
- Configure Status – The configured status of the ad
- Account Name – Name of the ad account and name of business profile (if applicable). If the account name is not set, the name of the first admin visible to the user will be returned
- Business Country – Country code for the business address
- Adset Name – A group of ads that share the same budget and are usually about a single topic
- Campaign Name – A group of ad sets that share the same objective
- Objective – The objective you selected for your ad, ad set, or campaign. Your objective reflects what you want to achieve with ads
- Account Status – Status of the account
- Action Type – Type of Action
- Status – Status of the ad
- Tags – Tags associated with this campaign
- Business Name – The name of business account
Measures
- Action Values – The total revenue returned from conversions or Facebook credit spends
- Actions Count – The number of actions taken on your ad, Page, app or event after your ad was served to someone, even if they didn’t click on it. Actions include Page likes, app installs, conversions, event responses and more. For example, 2 Page likes and 2 comments would be counted as 4 actions
- Per Action Type – The average you’ve spent on actions. For example, if you spent $20 and you got 10 Page likes, each one cost an average of $2
- Per Unique Action Type – The average you paid for each type of unique action
- Unique Actions – The number of unique people who took an action such as liking your Page or installing your app as a result of your ad. For example, if the same person likes and comments on a post, they will be counted as 1 unique person
- CTR (Product) – The number of link clicks a product received divided by the number of impressions of the product, only applicable for multi-product ads
- Total Views Video (10 sec) – This shows the number of total views of at least 10 seconds or to the end of your video, whichever occurs first
- Total Views Video (15 sec) – The number of times your video was viewed more than 15 seconds, including views that skipped to this point
- Total Views Video (30 sec) – This shows the number of total views of at least 30 seconds or to the end of your video, whichever occurs first
- Audience Retention – This is the total video watch time divided by views of your video over your video’s duration. This is not applicable for live videos
- Video Percentage Watched – not supported by Facebook API 4.0
- Video Average Watch Time – This is the total video watch time for your video divided by the total number of plays of your video
- Total Views Video (Complete) – This shows the number of total views of at least 30 seconds or to the end of your video, whichever occurs first
- Total Views (100%) – The number of times your video was viewed to 100% of its length, including views that skipped to this point
- Total Views (25%) – The number of times your video was viewed to 25% of its length, including views that skipped to this point
- Total Views (50%) – The number of times your video was viewed to 50% of its length, including views that skipped to this point
- Total Views (75%) – The number of times your video was viewed to 75% of its length, including views that skipped to this point
- Total Views (95%) – not supported by Facebook API 4.0
- Number of Records – Number of Records
Templates
- Ads. Number of Actions over the last 30 days – View the total number of actions people took that are attributed to your ads. Actions may include engagement, clicks or conversions.
- Number of Actions by Action Type (last 30 days) – View the number of actions by action type for ads in a given time period.
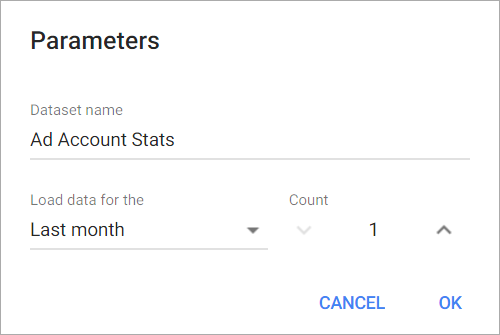
When creating new dataset, you can set a time period for data from your service to be uploaded and represented. Go here to learn more about selecting/changing time period for data in your dataset.
Creating a Chart
Click a dataset or integration and select Create dashboard/Create chart/Create presentation to start building a chart (please note that presentations are available starting from the Standard Plan).
From the next page, you can choose to create your own chart from scratch, or you can apply one of the templates we created.
- If you choose to build a new chart from scratch (“Blank” option), the Chart designer will open. Go here to learn how to create a chart in the Chart editor.
- If you choose a template, a new chart will be added to a dashboard/saved chart/presentation (depending on the way you start the chart creation).