

Google Analytics is an industry standard freemium web and mobile analytics package.
In this article, you’ll find the answers to the following questions:
- How to connect my Google Analytics data?
- How to create a chart on my Google Analytics integration?
- Which templates are available for the Google Analytics integration?
- Why can’t I aggregate my Google Analytics data?
- How to refresh my data?
Creating an Integration
From your Slemma account, head over to the Library page and click the plus button at the bottom right. Select Integration from the submenu.
From the next page, you can find Google Analytics with one of the following ways:
- Scroll down and select Google Analytics from the list.
- Use search icon from the top right corner of the window.
- Open the All dropdown and select Analytics.
Click the integration.
Login to your Google account and grant Slemma permission to access your Google Analytics data (you need to do it once).
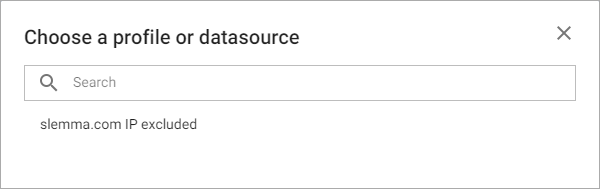
Once you’ve granted permission, you’ll be redirected to the Select a profile or datasource window.
After providing your account details, the integration will be created and it will appear in your account in the list of objects. Now you are able to share the integration with either individuals or the entire Team, rename or remove the integration. To view the options available for the integration, right click it in the list.
You can now create charts and dashboards with your Google Analytics data.
Data Restrictions
There is a limit of 100K elements for each dimension.
By default, Slemma upload data for the last three years. You can select any other date Range in the chart filter.
Creating a Dataset
You are not able to create or edit datasets based on the Google Analytics integration. To create a chart on this integration, follow the steps below.
Creating a Chart
Click the integration and select Create dashboard/Create chart/Create presentation to start building a chart (please note that presentations are available starting from the Standard plan).
From the next page, you can choose to create your own chart from scratch, or you can apply one of the templates we created (explore the list below).
- If you select to build new chart from scratch, the Chart designer will open.
- If you select a template, the new chart will be added to a dashboard/saved chart/presentation (depending on the way you start the chart creation).
Building a chart from scratch
If you select to build new chare from scratch, the Chart designer will open. Go here to learn how to create a chart in the Chart designer.
Visit Google Analytics documentation to learn more what metrics and dimensions Google Analytics API provides.
NOTE: Not all Google Analytics metrics and dimensions can be queried together. You can check if a dimension and metric combination is valid from within Google’s documentation from the above link.
Why can’t I aggregate my google analytics data?
The Google Analytics API only allows querying data directly, and does not allow us to aggregate the retrieved data.
In some cases Google Analytics API provides already aggregated data. For instance, Sessions is already a count of sessions. Users is already a count of users.
If you need to apply aggregations on top of Google Analytics metrics, such as average of sessions, you can always create a calculated metric.
Templates
Instead of starting from scratch when building a chart, you can use a pre-built visualization. Simply click one of the templates from the list and it will be added to the dashboard filled with your data. You can then edit and customize this template like a usual chart created by you.
The following templates are available for the Google Analytics integration:
- 30 Days Active users
- Average Page Load Time
- Average Redirection Time
- Average Server Response Time
- Average Time on Page
- Bounce Rate
- Bounces by Country
- Load Time vs Response Time
- New Users by Social Network
- New vs Returning Visitors
- Sessions by Age
- Sessions by Browser
- Sessions by City
- Sessions by Country
- Sessions by Device Category
- Sessions by Gender
- Sessions by Hour
- Sessions by Interests (Affinity Categories)
- Sessions by Interests (In-Market Segment)
- Sessions by Interests (Other Categories)
- Sessions by Language
- Sessions by Mobile Device Branding
- Sessions by Mobile Operating System
- Sessions by Mobile Screen Resolution
- Sessions by Operating System
- Sessions by Regions
- Top 10 Countries by Users
- Top 10 Source by Number of Users
- Top 10 Source/Medium by # of Users
- Users and Goals over the last 30 days
- Users, Sessions, and Pageviews over the last 30 days
Refreshing data
You can select the frequency for the automatic updates by right-clicking the integration and selecting Schedule refresh (available starting from Small Business plan).
To fetch fresh data and not to wait for an automatic update, right click the integration and choose Refresh now from the menu. Once chosen, this option enables Slemma to connect directly to the cloud service and refresh data.