Intercom

Estimated reading time: 5 min

Intercom is a fundamentally new way for internet businesses to communicate with customers, personally, at scale. It’s a customer communication platform with a suite of integrated products for every team—including sales, marketing, product, and support. Intercom’s products enable targeted communication with customers on your website, inside your web and mobile apps, and by email.

From this article you can learn:

Creating an Integration

From your Slemma account, head over to the Library page and click the plus button at the bottom right. Select Integration from the submenu.

In the following page, you can find Intercom with one of the following ways:

  1. Scroll down and select Intercom from the list of Integrations.
  2. Use search to find Intercom from the list of Integrations.
  3. Choose Intercom using All dropdown list > Customer Success.

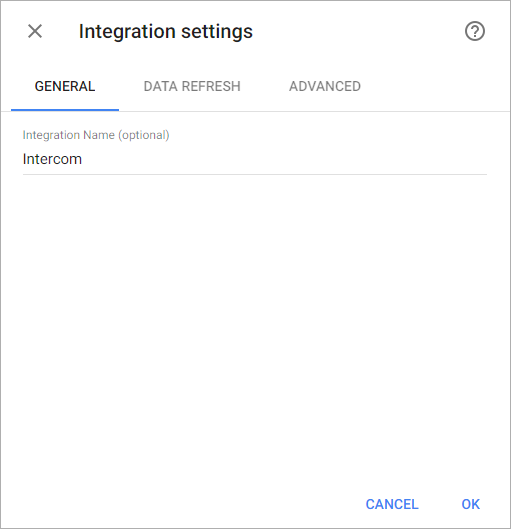
You’ll see the Integration settings dialog window. You can select the frequency for the automatic updates on the DATA REFRESH tab, or set weeks settings on the ADVANCED tab. Click OK.

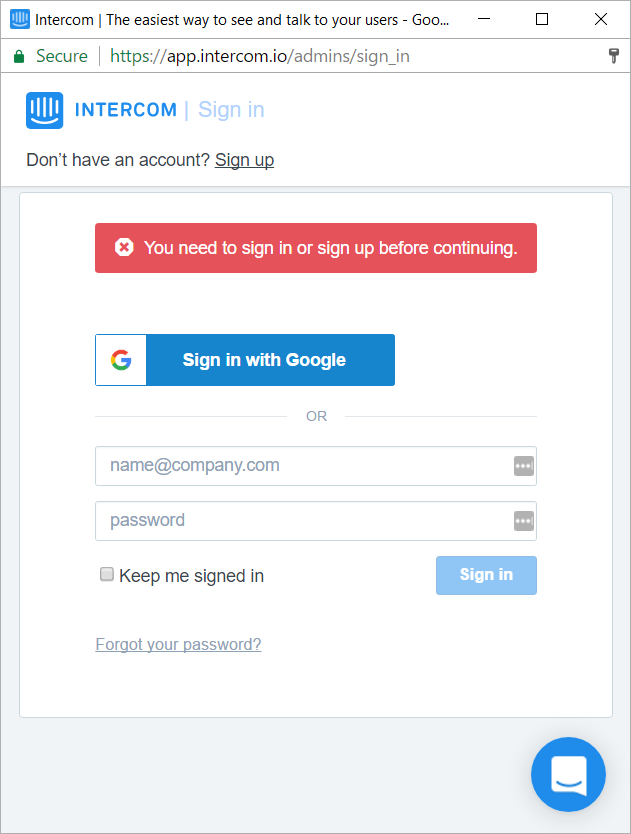
Log into your Intercom account.

After authorization, grant Slemma permissions to access your data and click Connect.

After that, the integration will be created and it will appear in your account in the list of objects. Now you are able to share the integration with either individuals or the entire Team, rename or remove the integration. To view the options available for the integration, right click it in the list.

Creating a Dataset

A dataset is a collection of data in a tabular format that is created on one of the possible data sources. The datasets can be used to create dashboards or individual charts.

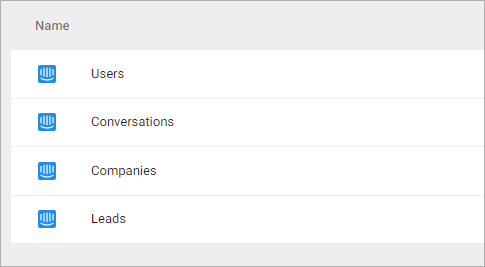
To create a dataset, click your Intercom integration in the list and select Browse datasets. From the following page, select which data you want to add to use in your charts.

NOTE: Cloud Service Integrations have prebuilt datasets that are not editable.

Click dataset’s name for a description of each dataset.

This data source contains information about all your users such as user count by location, and your custom fields per user.

Dimensions

  1. Anonymous – Whether or not this is a lead
  2. Browser – The name of the browser in which the last user agent the user was seen using
  3. Country – The country of the user
  4. Company – The array of companies associated with this user
  5. Created date – Date the user was created
  6. ID – A unique identifier for the user
  7. OS – The name of the operating system in which the last user agent the user was seen using
  8. Segment – The array of segments associated with this user
  9. Tag – The array of tags associated with this user
  10. Type – Value is ‘user’
  11. Unsubscribed from emails – Whether the user is unsubscribed from emails
  12. UserName – The name and email address of the user
  13. Facebook Nickname – The Facebook profile associated with this user
  14. Twitter Nickname – The Twitter profile associated with this user
  15. LinkedIn Nickname – The LinkedIn profile associated with this user

+ Custom Dimensions – Your custom fields (not numeric)

Measures

  1. Session count – How many sessions the user has recorded
  2. Users Count – Users Count

+ Custom Measures – Your custom fields (numeric)

Templates

  1. Number of Users by Segment – Monitor your segments by number of users.
  2. Number of Users Created over the last 30 days – Discover how many users you have gained over the last 30 days or during the period of your choice.
  3. Top 10 Companies by Number of Users – Monitor your top 10 companies by number of users.
  4. Users vs. Leads Created over the last 30 days – Compare the number of the users and number of the leads over the last 30 days.

This data source contains information about all your conversations such as conversation count by status (open or closed) and number of the unique assignee.

Dimensions

  1. Date – Date the conversation was created
  2. Updated at – Date the conversation was updated
  3. ID – The id representing the conversation
  4. Assignee – The email address of the admin the conversation is currently assigned to
  5. Open – Indicates whether a conversation is open (true) or closed (false)
  6. Read – Indicates whether a conversation has been read
  7. Type – Value is ‘conversation’
  8. User – The email address of the user the conversation concerns
  9. Company – The array of companies associated with user

Measures

  1. Assignee (distinct) – The number of unique assignees
  2. User (distinct) – The number of unique users
  3. Conversations Count – Conversations Count

Templates

  1. Number of Conversations by Status over the last 30 days – Get a total count of open and closed conversations over the last 30 days.
  2. Top 10 Agents by Number of Open Conversations – Monitor your top 10 agents by number of open conversations.

This data source contains information about all your leads such as lead count by location, and your custom fields per lead.

Dimensions

  1. Browser – The name of the browser in which the last user agent the lead was seen using
  2. Country – The country of the lead
  3. Company – The array of companies associated with this lead
  4. City – The city of the lead
  5. Created date – Date the lead was created
  6. OS – The name of the operating system in which the last lead agent the user was seen using
  7. Segment – The array of segments associated with this lead
  8. Tag – The array of tags associated with this lead
  9. Unsubscribed from emails – Whether the lead is unsubscribed from emails
  10. UserName – The name and email address of the lead

+ Custom Dimensions – Your custom fields (not numeric)

Measures

  1. Leads Count – Leads Count

+ Custom Measures – Your custom fields (numeric)

Templates

  1. Users vs. Leads Created over the last 30 days – Compare the number of the users and number of the leads over the last 30 days.

This data source contains information about all your companies. Companies allow you to represent commercial organizations using your product.

Dimensions

  1. Created date – Date the company was created
  2. Name – The name of the company
  3. Plan – The name of the plan you have associated with the company
  4. Segment – The array of segments associated with this company
  5. Tag – The array of tags associated with this company

Custom Dimensions – Your custom fields (not numeric)

Measures

  1. Session count – How many sessions the company has recorded
  2. Monthly spend – How much revenue the company generates for your business
  3. User count – The number of users in the company
  4. Number of companies – Number of companies

Custom Measures – Your custom fields (numeric)

Creating a Chart

Click a dataset or integration and select Create dashboard/Create saved chart/Create presentation to start building a chart (please note that presentations are available starting from the Standard Plan).

From the next page, you can choose to create your own chart from scratch, or you can apply one of the templates we created.

  • If you choose to build a new chart from scratch (“Blank” option), the Chart designer will open. Go here to learn how to create a chart in the Chart designer.
  • If you choose a template, a new chart will be added to a dashboard/saved chart/presentation (depending on the way you start the chart creation).
Was this article helpful?
Dislike 0
Views: 429