

This integration enables to visualize projects progress.
Currently, Slemma Jira connector supports cloud version of Jira only.
From this article you can learn:
- How to create a connection with Jira
- How to create an API Token for an integration
- How to get data from Jira
- How to create a chart on Jira data
- Which templates are available for the Jira integration
Creating an Integration
From your Slemma account, head over to the Library page and click the plus button at the bottom right. Select Integration from the submenu.
In the following page, you can find Jira with one of the following ways:
- Scroll down and select Jira from the list of Integrations.
- Use search to find Jira from the list of Integrations.
- Choose Jira using All dropdown list > Other.
You’ll see the Integration settings dialog window.
You can select the frequency for the automatic updates on the DATA REFRESH tab (For Jira datasets, you can also enable Incremental updates option), or set weeks settings on the ADVANCED tab.
Leave this page open for now – we’ll need it to complete the setup.

Fill Login and API Token fields and click OK.
How to create an API token from your Atlassian account
- Log in to https://id.atlassian.com/manage/api-tokens
- Click Create API token.
- From the dialog that appears, enter a memorable and concise Label for your token and click Create.
- Click Copy to clipboard, then paste the token to the integration pop up window in your Slemma account
After providing your account and API Token details, you’ll be able to share the integration with either individuals or the entire Team, rename or remove the integration. To view the options available for the integration, right click it in the list.
Creating a Dataset
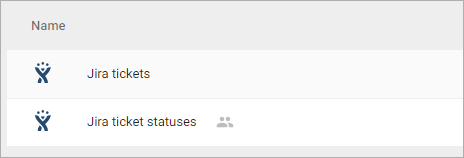
To create a dataset, click your Jira integration in the list and select Browse datasets. From the following page, select which data you want to add to use in your charts.
NOTE: Cloud Service Integrations have prebuilt data sets that are not editable. There is a limit of 100K tickets for each Jira dataset.
Creating a Chart
Click a dataset or integration and select Create dashboard/Create chart/Create presentation to start building a chart (please note that presentations are available starting from the Standard Plan).
From the next page, you can choose to create your own chart from scratch, or you can apply one of the templates we created.
- If you choose to build a new chart from scratch (“Blank” option), the Chart designer will open. Go here to learn how to create a chart in the Chart editor.
- If you choose a template, a new chart will be added to a dashboard/saved chart/presentation (depending on the way you start the chart creation).
Templates
Instead of starting from scratch when building a chart, you can use a pre-built visualization. Simply click one of the templates from the list and it will be added to the dashboard filled with your data. You can then edit and customize this template like a usual chart created by you.
The following templates are available in Slemma for the Jira integration:
- Assignee Work Days Breakout over the last 30 days
- Created vs. Closed Bugs over the last 30 days
- Number of Issues per Assignee by Issue Type over the last 30 days
- Number of Issues Created by Type over the last 30 days
- Issues’ Estimated vs. Spent Time over the last 30 days
- MoM Issues Growth by Type
- Number of Issues by Project Name over the last 30 days
- Issues in Progress by Assignee over the last 6 months
- Max Resolution Time over the last 30 days
- Median Resolution Time over the last 30 days
- Sprints Breakout by Issue Type
- Top 10 Creators by Number of Issues
- Top 10 Assignees by Median Work Time
- Number of Issues by Priority and Types