

In this article, you’ll find the answers to the following questions::
- How to connect my Mixpanel data?
- How to create a chart on my Mixpanel integration?
- Which templates are available for the Mixpanel integration?
Creating an Integration
From your Slemma account, head over to the Library page and click the plus button at the bottom right. Select Integration from the submenu.
In the following page, you can find Mixpanel with one of the following ways:
- Scroll down and select Mixpanel from the list of Integrations.
- Use search to find Mixpanel from the list of Integrations.
- Choose Mixpanel using All dropdown list > CRM.
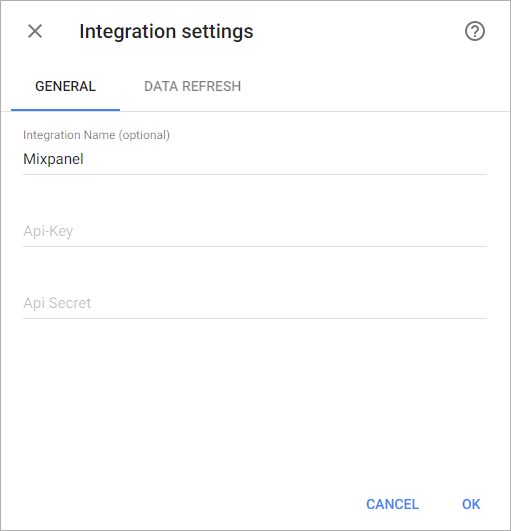
You’ll see the Integration settings dialog window. You can select the frequency for the automatic updates on the DATA REFRESH tab, or set weeks settings on the ADVANCED tab.
Leave this page open for now – we’ll need it to complete the setup.
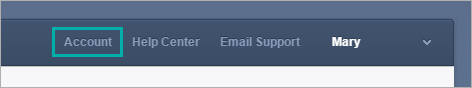
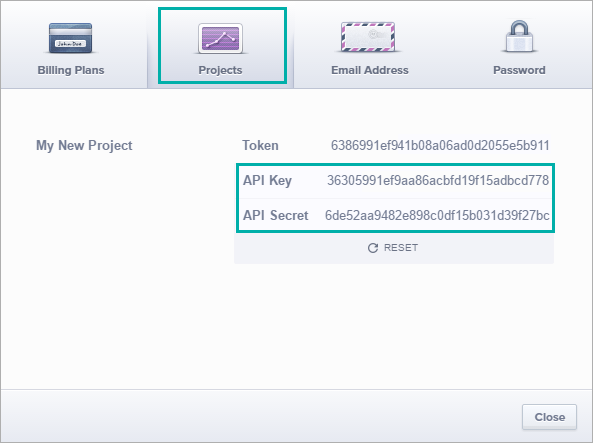
To generate your APIs , from your Mixpanel page, click the Account button and choose Projects tab in the appeared window.
Copy API Key and API Secret and paste them to the Integration settings window. Click OK.
After that, you’ll be able to share the integration with either individuals or the entire Team, rename or remove the integration. To view the options available for the integration, right click it in the list.
Creating Dataset
A dataset is a collection of data in a tabular format that is created on one of the possible data sources. The datasets can be used to create dashboards or individual charts.
To create People or Transactions dataset, click your Mixpanel integration in the list and select Browse datasets. From the following page, select which data you want to add to use in your charts.
Custom Events and Mixpanel Events datasets are “online” datasets. You are not able to create or edit these datasets, or create a calculated measure. To create a chart on these datasets, follow the instruction below.
Creating a Chart
Click an integration and select Create dashboard/Create saved chart/Create presentation to start building a chart (please note that presentations are available starting from the Standard Plan).
From the next page, you can choose to create your own chart from scratch, or you can apply one of the templates we created.
- If you choose to build a new chart from scratch (“Blank” option), the Chart designer will open. Go here to learn how to create a chart in the Chart designer.
- If you choose a template, a new chart will be added to a dashboard/saved chart/presentation (depending on the way you start the chart creation).
Templates
Instead of starting from scratch when building a chart, you can use a pre-built visualization. Simply click one of the templates from the list and it will be added to the dashboard filled with your data. You can then edit and customize this template like a usual chart created by you.
The following templates are available for the Mixpanel integration:
- Event by Initial Referring Domain
- Top 10 Countries by # of Events over the last 30 days
- Total Events by Browser
- Total Events by Country over the last 30 days
- Total Events over the last 30 days
- Total vs. Unique Events over the last 30 days