

PayPal is a fast, safe way to send money, make an online payment, receive money or set up a merchant account.
In this article, you’ll find the answers to the following questions:
- How to connect my PayPal account with Slemma?
- How to get data from PayPal?
- How to create a chart on my PayPal integration?
Creating an Integration
From your Slemma account, head over to the Library page and click the plus button at the bottom right. Select Integration from the submenu.
In the following page, you can find PayPal with one of the following ways:
- Scroll down and select PayPal from the list of Integrations.
- Use search to find PayPal from the list of Integrations.
- Choose PayPal using All dropdown list > Payment Processing.
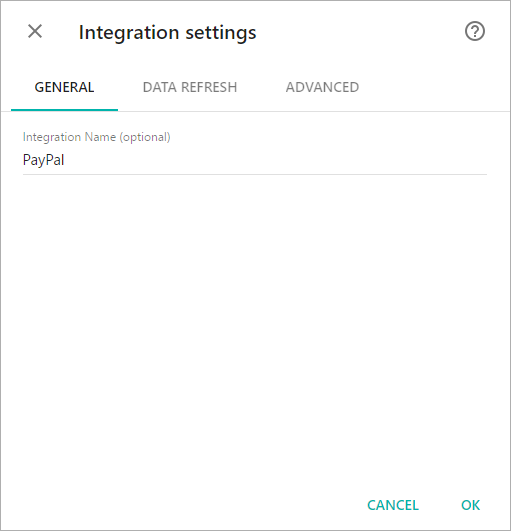
You’ll see the Integration settings dialog window. You can select the frequency for the automatic updates on the DATA REFRESH tab, or set weeks settings on the ADVANCED tab. Click OK.
You’ll be directed to a page to sign in.
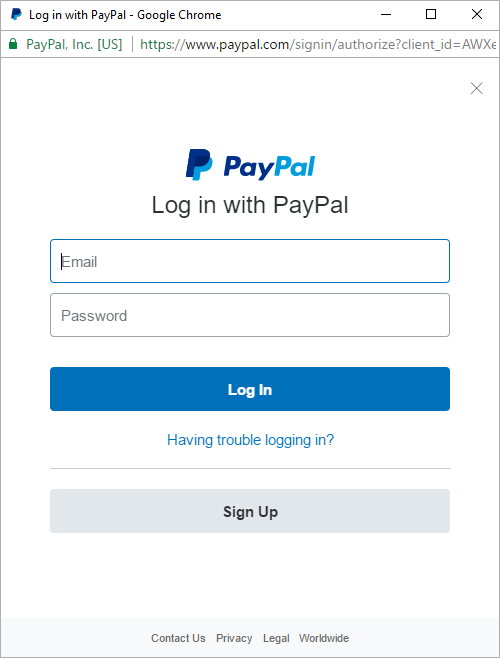
Enter your email address and password to sign in.
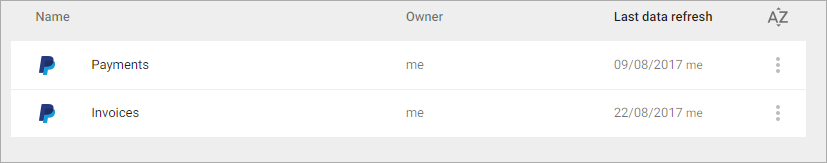
After authorization, you’ll be able to share the integration with either individuals or the entire Team, rename or remove the integration. To view the options available for the integration, right click it in the list.
Creating a Dataset
A dataset is a collection of data in a tabular format that is created on one of the possible data sources. The datasets can be used to create dashboards or individual charts.
NOTE: Cloud Service Integrations have prebuilt data sets that are not editable.
To create a dataset, click your PayPal integration in the list and select Browse datasets. From the following page, select which data you want to add to use in your charts.
Click dataset’s name for a description of each dataset.
The Invoices data source contains information about all of your invoices such as amount by status and merchant.
Dimensions
| № | Name | Description |
| 1. | Currency | The three-character ISO-4217 currency code |
| 2. | Date | The date the invoice was created |
| 3. | Country | Name of the billing country |
| 4. | Invoice number | The invoice number |
| 5. | Merchant | The merchant email address |
| 6. | Recipient | The invoice recipient email address |
| 7. | Status | The invoice status. Possible values: draft, sent, paid, marked_as_paid, cancelled, refunded, partially_refunded, marked_as_refunded, unpaid, payment_pending |
Measures
| № | Name | Description |
| 1. | Amount | The total amount of the invoice |
| 2. | Shipping amount | The shipping amount |
| 3. | Shipping tax amount | The calculated shipping tax amount |
| 4. | Discount by units | The calculated discount amount for all units |
| 5. | Other discount | If you specify a discount in percent the other discount calculated as amount discount by units and subtotal devided 100% |
| 6. | Tax amount | The amount of tax |
| 7. | Units count | The number of the items for this invoice |
| 8. | Quantity | Total quantity for all units including in this invoice |
| 9. | Invoices Count | Invoices Count |
Templates
Instead of starting from scratch when building a chart, you can use a pre-built visualization. Simply click one of the templates from the list and it will be added to the dashboard filled with your data. You can then edit and customize this template like a usual chart created by you.
- Discount Amount over the last 30 days – See the discount amount by units of the invoices that have created over a given date range.
- Net Revenue vs. Tax, Shipping and Discount Amount over the last 30 days – Compare the net revenue, total tax, shipping amount and discount amount for the time period of your choice.
- Top 10 Recipients by Invoice Amount over the last 30 days – View your top ten recipients by total amount for the time period of your choice.
- Total Invoiced Amount by Country over the last 30 days – Track the total amount of invoices your recipients from different countries over the last 30 days or during the period of your choice.
- Total Invoice Amount by Status over the last 30 days – Compare the total amount by invoice statuses over the last 30 days.
This data source contains information about all of your transactions such as transaction amount by payer email and billing country.
Dimensions
| № | Name | Description |
| 1. | State | The state of the payment, authorization, or order transaction. Possible values: created, approved, failed |
| 2. | Failure Reason | The reason code for a payment failure. Possible values: unable_to_complete_transaction, invalid_payment_method, payer_cannot_pay, cannot_pay_this_payee, redirect_required, payee_filter_restrictions |
| 3. | Created At | The date the payment was created |
| 4. | Updated At | The date the payment was last modified |
| 5. | Payer | The full name and email of the payer |
| 6. | Billing Country | Name of the billing country |
| 7. | Invoice Number | The invoice number to track this payment |
| 8. | Currency | The three-character ISO-4217 currency code |
Measures
| № | Name | Description |
| 1. | Total | The total amount charged to the payee by the payer |
| 2. | Subtotal | The subtotal amount for the items |
| 3. | Total Tax | The amount of tax |
| 4. | Shipping Cost | The shipping fee |
| 5. | Incurance Fee | The insurance fee |
| 6. | Handling Fee | The handling fee |
| 7. | Gift Wrap Fee | The gift wrap fee |
| 8. | Shipping Discount | The shipping fee discount |
| 9. | Payments Count | Payments Count |
Creating a Chart
Click a dataset or integration and select Create dashboard/Create saved chart/Create presentation to start building a chart (please note that presentations are available starting from the Standard Plan).
From the next page, you can choose to create your own chart from scratch, or you can apply one of the templates we created.
- If you choose to build a new chart from scratch (“Blank” option), the Chart designer will open. Go here to learn how to create a chart in the Chart editor.
- If you choose a template, a new chart will be added to a dashboard/saved chart/presentation (depending on the way you start the chart creation).