Pipedrive

Estimated reading time: 11 min

Pipedrive is a simple sales pipeline management tool loved by small and medium sized sales teams. Pipedrive makes you focus on the important deals first.

In this article, you’ll find the answers to the following questions:

Creating an Integration

From your Slemma account, head over to the Library page and click the plus button at the bottom right. Select Integration from the submenu.

In the following page, you can find Pipedrive with one of the following ways:

  1. Scroll down and select Pipedrive from the list of Integrations.
  2. Use search to find Pipedrive from the list of Integrations.
  3. Choose Pipedrive using All dropdown list > CRM.

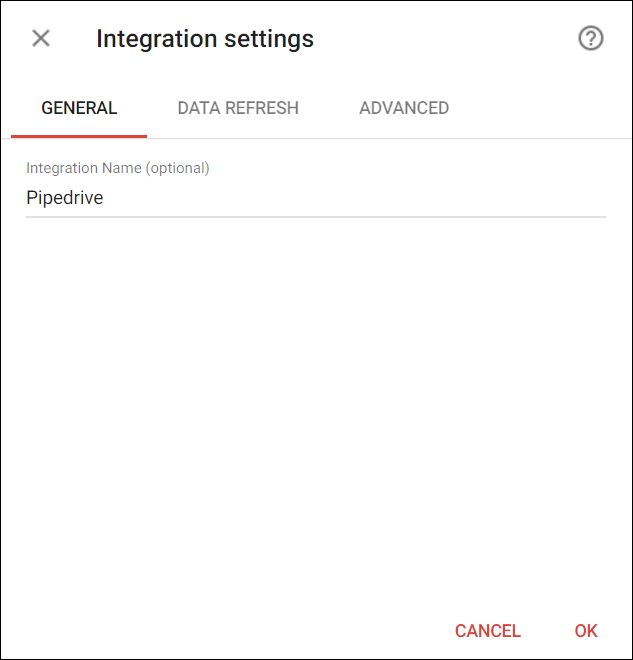
You’ll see the Integration settings dialog window.

You can select the frequency for the automatic updates on the DATA REFRESH tab (for Pipedrive datasets, you can enable Incremental updates option), or set weeks settings on the ADVANCED tab. Click OK.

You’ll be directed to a page to sign in. Enter the email address and password to log into your Pipedrive account.

After authorization, you’ll be able to share the integration with either individuals or the entire Team, rename or remove the integration. To view the options available for the integration, right click it in the list.

Creating a Dataset

A dataset is a collection of data in a tabular format that is created on one of the possible data sources. The datasets can be used to create dashboards or individual charts.

To create a dataset, click your Pipedrive integration in the list and select Browse datasets. From the following page, select which data you want to add to use in your charts.

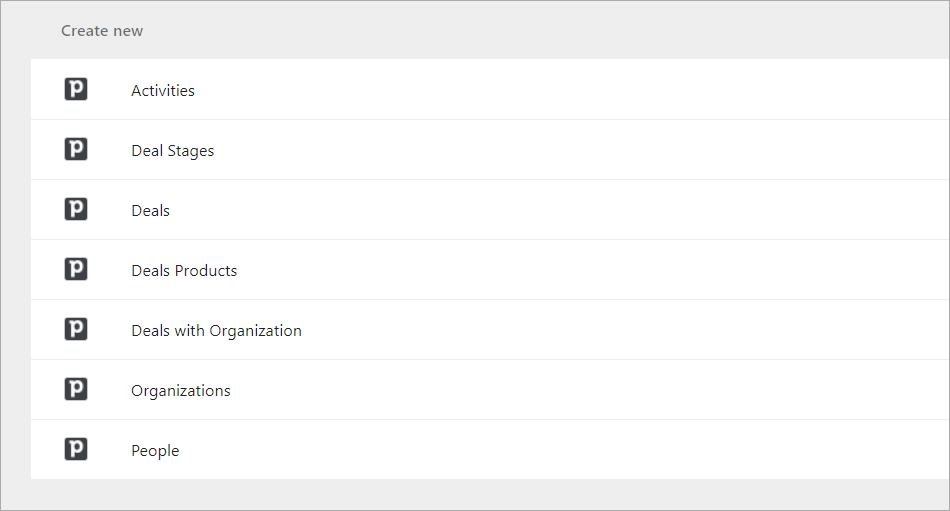
NOTE: Cloud Service Integrations have prebuilt data sets that are not editable.

Click dataset’s name for a description of each dataset.

This data source contains information about your Activities such as the associated deal and the Activity type (including custom types).

Dimensions

  1. Subject – The subject of the activity
  2. Deal – The name of the deal that linked with this activity
  3. Contact person – The full names of the contact that linked with this activity
  4. Organization – The names of the organizations that linked  with this activity
  5. Due date – Date when the activity should be completed
  6. Created at – Date the activity was initially created
  7. Done – “True” if the activity is done
  8. Type – The name of type for this activity, including custom activity types.
  9. Active – “True” if the deal is active
  10. Owner – The name of the user who owner of this activity
  11. Mark as Done – Date the activity was marked as done
  12. Updated at – Date the activity was updated last time
  13. Note – Activities notes
  14. Deal Won Time – Date the deal that linked with this activity was won
  15. Deal Lost Time – Date the deal that linked with this activity was lost
  16. Deal Id – The unique identifier for the deal
  17. Person ID – Person ID
  18. Deal Owner – The owner of the deal

Measures

  1. Activities count
  2. Days overdue – The number of days overdue past Due date
  3. Deal Value – The value from the deal

Templates

Instead of starting from scratch when building a chart, you can use a pre-built visualization. Simply click one of the templates from the list and it will be added to the dashboard filled with your data. You can then edit and customize this template like a usual chart created by you.

The following template available for this dataset:

  1. Number of Activities by Type
  2. Number of Activities over the last 30 days

This data source contains information about your Stages. While the Deals data source lets you analyze certain deals, this data source is focused on the performance of your Pipeline itself. An example is the average time a deal is in a certain Stage.

Dimensions

  1. Title – The title of the deal
  2. Creator – The name of the user who created this deal
  3. Owner – The name of the user who owner of this deal
  4. Organization – The names of the organizations that linked  with this deal
  5. Contact person – The full names of the contact that linked with this deal
  6. Created at – Date the deal was initially created
  7. Updated at – Date the deal was updated last time
  8. Last stage change – Date the deal stage was changed last time
  9. Stage Move Date – Date the deal when was last moved to a stage, will return N/A if a stage is skipped
  10. Next activity date – Date of the next activity of the deal
  11. Last activity date – Date of the last activity of the deal
  12. Won time – Date the deal was won
  13. Lost time – Date the deal was lost
  14. Deal closed on – Date the deal was closed
  15. Lost reason – The reason of the deal lost
  16. Expected close date – This is the date you predict the deal will be closed
  17. Currency – The currency for this deal
  18. Active – “True” if the deal is active
  19. Deleted – “True” if the deal is deleted
  20. Status – The status of the deal
  21. Pipeline – The name of pipeline for this deal
  22. Deal Id – Deal Id
  23. Stage – The name of stage for this deal

Measures

  1. Time – Total seconds when the deals were in stages
  2. Time in Stage (hours) – Total hours when the deals were in stages
  3. Time in Stage (days) – Total days when the deals were in stages
  4. Time in Stage (weeks) – Total weeks when the deals were in stages
  5. Time in Stage (months) – Total months when the deals were in stages
  6. Stages count – Stages count, the number of Stages your deals were ever in

This data source contains information about your Deals such as how many are currently in a certain stage and when are your highest value deals expected to close.

Dimensions

  1. Title – The title of the deal
  2. Creator – The name of the user who created this deal
  3. Owner – The name of the user who owner of this deal
  4. Organization – The names of the organizations that linked  with this deal
  5. Contact person – The full names of the contact that linked with this deal
  6. Stage – The name of the current sequential stage
  7. Created at – Date the deal was initially created
  8. Updated at – Date the deal was updated last time
  9. Last stage change – Date the deal stage was changed last time
  10. Next activity date – Date of the next activity of the deal
  11. Last activity date – Date of the last activity of the deal
  12. Won time – Date the deal was won
  13. Lost time – Date the deal was lost
  14. Deal closed on – Date the deal was closed
  15. Lost reason – The reason of the deal lost
  16. Expected close date – This is the date you predict the deal will be closed
  17. Currency – The currency for this deal
  18. Active – Is the deal active?
  19. Deleted – Is the deal deleted?
  20. Status – The status of the deal
  21. Pipeline – The name of pipeline for this deal
  22. Deal Id – Deal Id
  23. Person ID – Person ID

+ All Custom Dimensions – custom fields without ‘Numerical’ type data.

Measures

  1. Value – Total worth for this deal
  2. Total activities – The number of total activities associated with the deal
  3. Done activities – The number of done activities associated with the deal
  4. Undone activities – The number of undone activities associated with the deal
  5. Email messages count – The number of email messages associated with the deal
  6. Products count – The number of products that linked with this deal
  7. Expected Close Date Overdue – The expected number of days overdue of Close Date
  8. Probability – The number from 1 to 100 representing the probability of winning for this deal
  9. Time in Current Stage – The total time the deal has spent in its current stage
    Formula: (Current date) – (Last stage change)
  10. Deal Lifetime – The total time a deal has existed
    Formula: If a status = “Won” then (Won Time- Created At). If a status <> “Won” then (Current Date)-(Created At)
  11. Deals count

+All Custom Measures – All custom fields which have ‘Numerical’ or ‘Monetary’ type

Templates

Instead of starting from scratch when building a chart, you can use a pre-built visualization. Simply click one of the templates from the list and it will be added to the dashboard filled with your data. You can then edit and customize this template like a usual chart created by you.

The following template available for this dataset:

  • Deals Pipeline
  • Number of Deals Closed over the last 12 months
  • Sales Team Leaderboard by Number of Activities over the last 30 days
  • Top 10 Deals by Amount

This data source contains information about your Deals with custom fields from the organization.

Dimensions

  1. Title – The title of the deal
  2. Creator – The name of the user who created this deal
  3. Owner – The name of the user who owner of this deal
  4. Organization – The names of the organizations that linked  with this deal
  5. Contact person – The full names of the contact that linked with this deal
  6. Stage – The name of the current sequential stage
  7. Created at – Date the deal was initially created
  8. Updated at – Date the deal was updated last time
  9. Last stage change – Date the deal stage was changed last time
  10. Next activity date – Date of the next activity of the deal
  11. Last activity date – Date of the last activity of the deal
  12. Won time – Date the deal was won
  13. Lost time – Date the deal was lost
  14. Deal closed on – Date the deal was closed
  15. Lost reason – The reason of the deal lost
  16. Expected close date – This is the date you predict the deal will be closed
  17. Currency – The currency for this deal
  18. Active – Is the deal active?
  19. Deleted – Is the deal deleted?
  20. Status – The status of the deal
  21. Pipeline – The name of pipeline for this deal
  22. Deal Id – Deal Id

All Custom Dimensions 

All Custom Dimensions from Organizations 

Measures

  1. Value – Total worth for this deal
  2. Total activities – The number of total activities associated with the deal
  3. Done activities – The number of done activities associated with the deal
  4. Undone activities – The number of undone activities associated with the deal
  5. Email messages count – The number of email messages associated with the deal
  6. Products count – The number of products that linked with this deal
  7. Expected Close Date Overdue – The expected number of days overdue of Close Date
  8. Probability – The number from 1 to 100 representing the probability of winning for this deal
  9. Time in Current Stage – The total time the deal has spent in its current stage
    Formula: (Current date) – (Last stage change)
  10. Deal Lifetime – The total time a deal has existed
    Formula: If a status = “Won” then (Won Time- Created At). If a status <> “Won” then (Current Date)-(Created At)
  11. Deals count

+All Custom Measures – All custom fields which have ‘Numerical’ or ‘Monetary’ type

+Custom Measures from Organizations

This data source contains information about your products as they relate to deals such as the quantity of certain products to be sold by estimated deal close date.

Dimensions

  1. Deal – The title of the deal
  2. Deal creator – The name of the user who created this deal
  3. Deal owner – The name of the user who owner of this deal
  4. Organization – The names of the organizations that linked  with this deal
  5. Contact person – The full names of the contact that linked with this deal
  6. Deal stage – The name of the current sequential stage
  7. Deal created at – Date the deal was initially created
  8. Deal updated at – Date the deal was updated last time
  9. Deal won time – Date the deal was won
  10. Deal lost time – Date the deal was lost
  11. Deal closed on – Date the deal was closed
  12. Deal lost reason – The reason of the deal lost
  13. Deal expected close date – This is the date you predict the deal will be closed
  14. Deal currency – The currency for this deal
  15. Deal active – “True” if the deal is active
  16. Deal deleted – “True” if the deal is deleted
  17. Deal status – The status of the deal
  18. Deal pipeline – The name of pipeline for this deal
  19. Deal Id – Deal Id
  20. Product – The name of the product linked with the deal
  21. Variation – The name of the variation of the product linked with the deal
  22. Product currency – The currency for this product

+ All Custom Dimensions – custom fields without ‘Numerical’ type data.

+ Custom Dimensions from Deals dataset

Measures

  1. Item price – The price of the one unit of the product in the deal in product currency
  2. Discount percentage – Percent of discount
  3. Duration – How many times is this product offered/sold
  4. Sum no discount – The amount which is set on a specific product within a specific deal (without discount)
  5. Sum – The amount, which is set on a specific product within a specific deal
  6. Quantity – Number of products associated with the deal
  7. Products count – A count of all the different products associated with all deals

+All Custom Measures – All custom fields which have ‘Numerical’ or ‘Monetary’ type

This data source contains information about your Organizations such as their latest activity and the number of messages associated with that organization.

Dimensions

  1. Name – The name of the organization
  2. Create at – The date the organization was initially created
  3. Owner – The full name of the user who created this organization
  4. Next activity date – Date of the next activity of the contacts of this organization
  5. Last activity date – Date of the last activity of the contacts of this organization
  6. Country – The name of the country from the organization address
  7. Region/State – The name of the region/state from the organization address
  8. City – The name of the city from the organization address

+ All Custom Dimensions – custom fields without ‘Numerical’ type data.

Measures

  1. People – The number of contacts associated with the organization
  2. Open deals – The number of open deals associated with the organization
  3. Won deals – The number of won deals associated with the organization
  4. Lost deals – The number of lost deals associated with the organization
  5. Closed deals – The number of closed deals associated with the organization
  6. Total activities – The number of total activities associated with the organization
  7. Done activities – The number of done activities associated with the organization
  8. Undone activities – The number of undone activities associated with the organization
  9. Email messages count – The number of email messages associated with the organization
  10. Organizations count

+All Custom Measures – All custom fields which have ‘Numerical’ or ‘Monetary’ type

Templates

Instead of starting from scratch when building a chart, you can use a pre-built visualization. Simply click one of the templates from the list and it will be added to the dashboard filled with your data. You can then edit and customize this template like a usual chart created by you.

The following template available for this dataset:

  • Number of Companies by Country
  • Number of Contacts Created over the last 12 months
  • Top 10 Companies by Number of Contacts
  • Top 10 Companies by Number of Won Deals

This data source contains information about your contacts such as when they were created, the number of won/lost deals for the contact, and completed activities.

Dimensions

  1. Name – The full name of the contact
  2. Email – Email address of the contact
  3. Create at – The date the contact was initially created
  4. Organization – The name of the organization for this contact
  5. Owner – The full name of the user who created this contact
  6. Next activity date – Date of the next activity of the contact
  7. Last activity date – Date of the last activity of the contact

+ All Custom Dimensions – custom fields without ‘Numerical’ type data.

Measures

  1. Open deals – The number of open deals associated with the contact
  2. Won deals – The number of won deals associated with the contact
  3. Lost deals – The number of lost deals associated with the contact
  4. Closed deals – The number of closed deals associated with the contact
  5. Total activities – The number of total activities associated with the contact
  6. Done activities – The number of done activities associated with the contact
  7. Undone activities – The number of undone activities associated with the contact
  8. Email messages count – The number of email messages associated with the contact
  9. People count

+All Custom Measures – All custom fields which have ‘Numerical’ or ‘Monetary’ type

Templates

Instead of starting from scratch when building a chart, you can use a pre-built visualization. Simply click one of the templates from the list and it will be added to the dashboard filled with your data. You can then edit and customize this template like a usual chart created by you.

The following template available for this dataset:

  • Number of Contacts Created over the last 12 months
  • Sales Team Leaderboard by Deals Amount

When creating new dataset,  you can set a time period for data from your service to be uploaded and represented. Go here to learn more about selecting/changing time period for data in your dataset.

Creating a Chart

Click a dataset or integration and select Create dashboard/Create saved chart/Create presentation to start building a chart (please note that presentations are available starting from the Standard Plan).

From the next page, you can choose to create your own chart from scratch, or you can apply one of the templates we created.

  • If you choose to build a new chart from scratch (“Blank” option), the Chart designer will open. Go here to learn how to create a chart in the Chart designer.
  • If you choose a template, a new chart will be added to a dashboard/saved chart/presentation (depending on the way you start the chart creation).
Was this article helpful?
Dislike 0
Views: 1643