

Pre-built calculations enable you to represent some tendencies in your data without creating new calculated measures manually.
NOTE: pre-built calculations are available for the following chart types: Bar chart, Time series, Combo chart, and Cross table.
How to add a pre-built calculation to a chart
Follow these steps to add pre-built calculation to your chart:
- From the Layout tab of the Chart designer, select a dimension.
- Click + ADD MEASURE and choose Calculations at the bottom of the list of existing measures.
- Choose a calculation that suits you more.
- Choose a measure, which will be used to perform a calculation, and select aggregation (if required).
There are five pre-built calculations available for all types of dimensions:
- Difference from Previous
- Percent from Previous
- Percent Difference from Previous
- Percent of Total
- Percent of Selected Elements
For Date dimensions, there are some additional pre-built calculations:
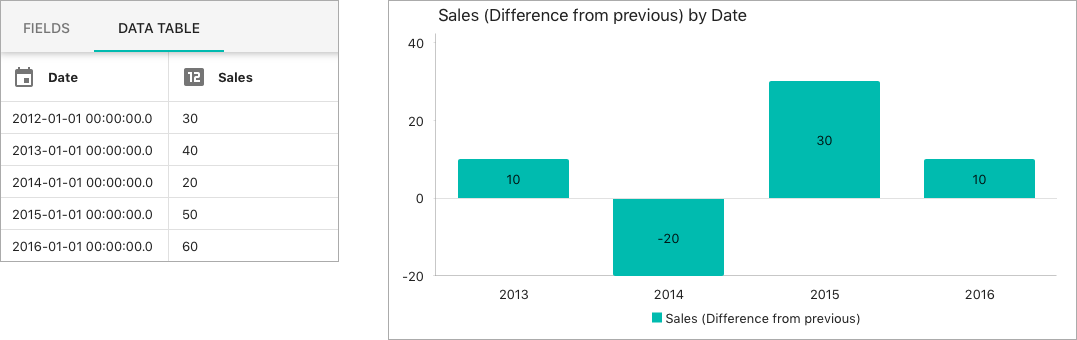
Difference from Previous
Shows the difference between the current value and the previous one.
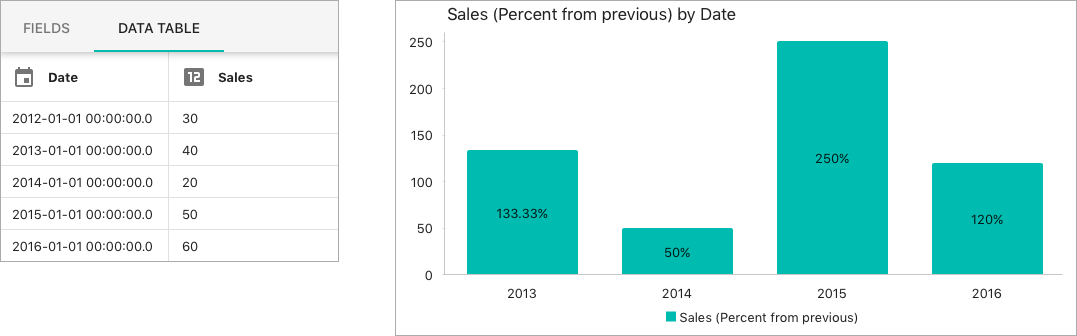
Percent from Previous
Shows the percentage difference between the current value and the previous one (absolute value).
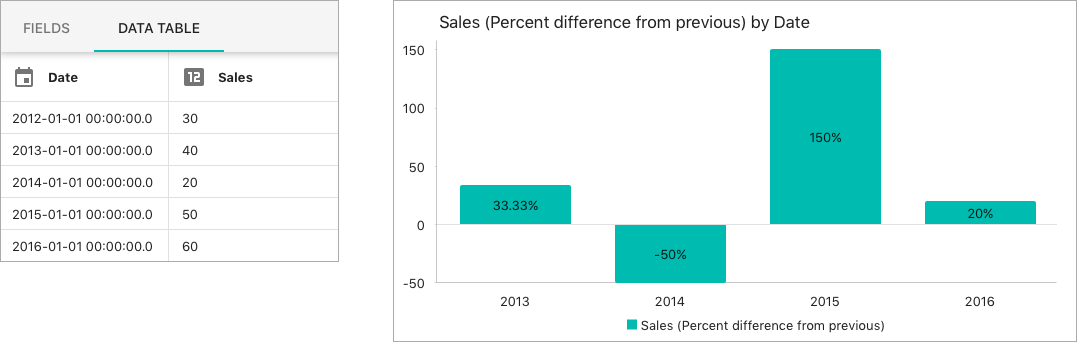
Percent Difference from Previous
Almost the same as Percent from Previous, but it represents increment of growth and can contain negative values.
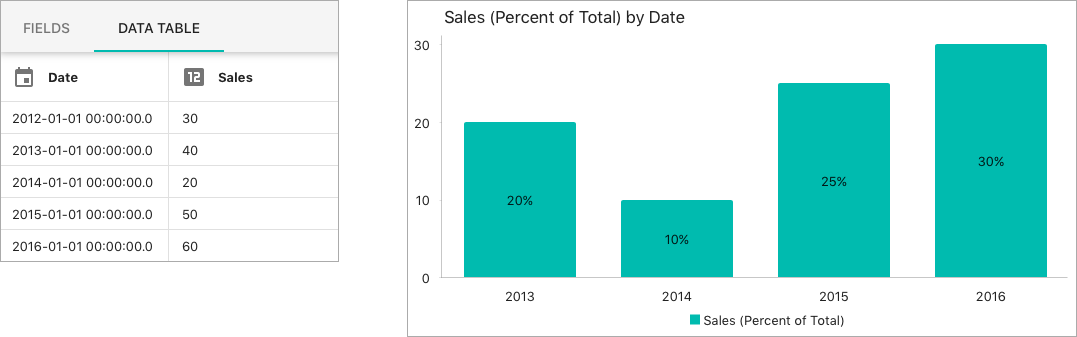
Percent of Total
Shows the share of the current value from total (total = sum of all the values).
Percent of Selected Elements
Almost the same as Percent of Total, but when you add a filter, it recalculates the total value and shows the shares of represented values from total of these values.
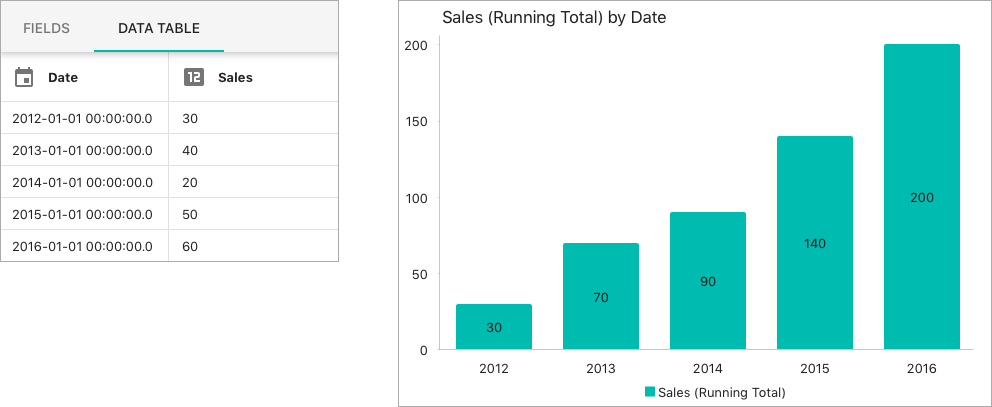
Running Total
At each step, it sums up the current value and the previous ones and thus represents cumulative sum.
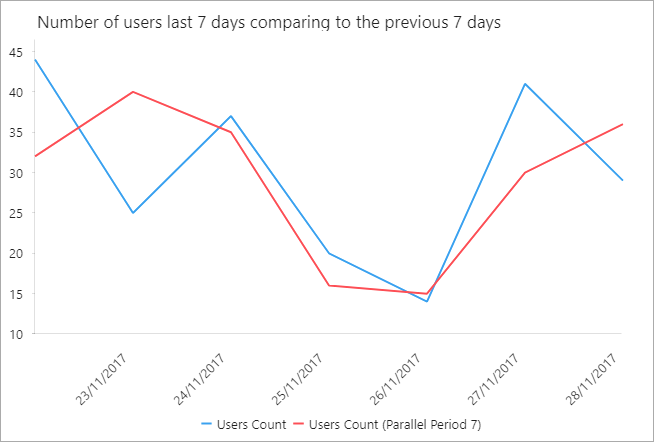
Parallel Period 7
Compares the selected period which has 7 steps (days, months, quarters, or years) with the similar previous period.
Add first measure and set the filter to show, for example, Last 7 days.
Then, click Add Measure > Calculations > Parallel Period 7 > select the same measure.
Parallel Period 14
Compares the selected period which has 14 steps (days, months, quarters, or years) with the similar previous period.
Parallel Period 28
Compares the selected period which has 28 steps (days, months, quarters, or years) with the similar previous period.
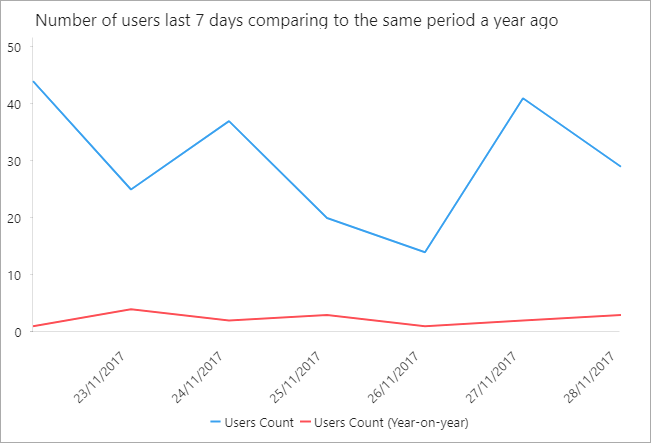
Year-on-year
Compares data for selected period with the same period 1 year ago.
Please note that for the Weeks date level, you should apply the “Last N weeks” filter to the chart.
NOTE: To learn how to create this calculation using MDX, please check this article.
Year-over-year (YoY comparison)
Compares data for the selected period with the same period 1 year ago (data this year/data a year ago-1).