

In this article, you’ll find the answers to the following questions:
- How to connect my QuickBooks account with Slemma?
- How to get data from QuickBooks?
- How to create a chart on my QuickBooks integration?
- Which templates are available for the QuickBooks integration?
Creating an Integration
From your Slemma account, head over to the Library page and click the plus button at the bottom right. Select Integration from the submenu.
In the following page, you can find QuickBooks with one of the following ways:
- Scroll down and select QuickBooks from the list of Integrations.
- Use search to find QuickBooks from the list of Integrations.
- Choose QuickBooks using All dropdown list > E-Commerce.
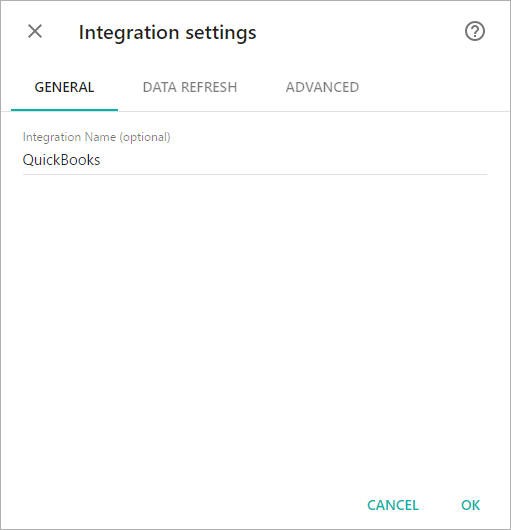
You’ll see the Integration settings dialog window. You can select the frequency for the automatic updates on the DATA REFRESH tab, or set weeks settings on the ADVANCED tab. Click OK.
You’ll be directed to a page to sign in.
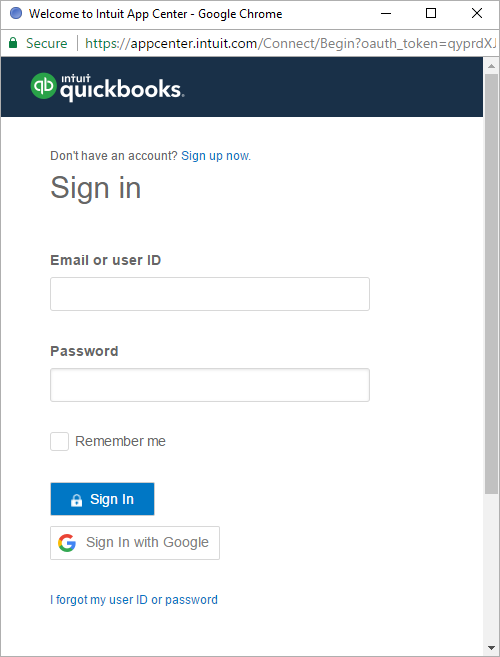
Login to you QuickBooks account and grant Slemma permission to access your data (you need to do it once).
After authorization, you’ll be able to share the integration with either individuals or the entire Team, rename or remove the integration. To view the options available for the integration, right click it in the list.
Creating a Dataset
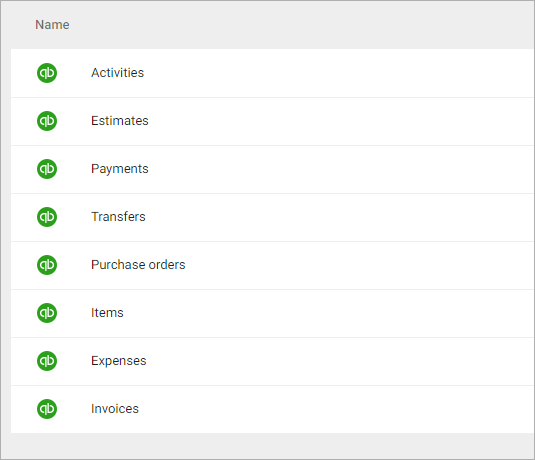
To create a dataset, click your QuickBooks integration in the list and select Browse datasets. From the following page, select which data you want to add to use in your charts.
NOTE: Cloud Service Integrations have prebuilt data sets that are not editable.
Creating a Chart
Click a dataset or integration and select Create dashboard/Create saved chart/Create presentation to start building a chart (please note that presentations are available starting from the Standard Plan).
From the next page, you can choose to create your own chart from scratch, or you can apply one of the templates we created.
- If you choose to build a new chart from scratch (“Blank” option), the Chart designer will open. Go here to learn how to create a chart in the Chart designer.
- If you choose a template, a new chart will be added to a dashboard/saved chart/presentation (depending on the way you start the chart creation).
Templates
Instead of starting from scratch when building a chart, you can use a pre-built visualization. Simply click on one of the templates from the list and it will be added to the dashboard filled with your data. You can then edit and customize this template like a usual chart created by you.
The following templates are available for the QuickBooks integration:
- Amount of Estimates by Status
- Cumulative Payments Amount over the last 30 days
- Expenses over the last 30 days
- Overdue Payables by Customer
- Payments Amount by Country
- Payments over the last 30 days
- Top 10 Customers by Balance
- Top 10 Customers by Payments Amount (last 30 days)
- Top 10 Most Active Employees
- Total Value of Purchase Orders by Vendor