Salesforce Cubes

Estimated reading time: 11 min

There are two versions of Salesforce connector in Slemma. Select the one that works for you:

  • Salesforce Reports – creates datasets based on your Salesforce reports. Slemma supports two types of Salesforce reports: SUMMARY (only primary information) and TABULAR. So when you create a dataset on Salesforce integration, you’ll see in the list only reports that have these types (one Slemma dataset for each Salesforce report). You should have REST API enabled for this integration.
  • Salesforce Cubes – creates datasets based on your Salesforce dimensions and measures organized in Cubes. You should have BULK API enabled for this integration.

In this article, we’ll describe a Salesforce Cubes integration. If you need to learn more about Salesforce Reports, please read this article.

Here you’ll find the answers to the following questions:

Creating an Integration

From your Slemma account, head over to the Library page and click the plus button at the bottom right. Select Integration from the submenu.

In the following page, you can find Salesforce Cubes with one of the following ways:

  1. Scroll down and select Salesforce Cubes from the list of Integrations.
  2. Use search to find Salesforce Cubes from the list of Integrations.
  3. Choose Salesforce Cubes using All dropdown list > CRM.

You’ll see the Integration settings dialog window. You can select the frequency for the automatic updates on the DATA REFRESH tab, or set weeks settings on the ADVANCED tab. Leave this page open for now – we’ll need it to complete the setup.

Enter your username and password and leave this page open for now – we’ll need it to complete the setup.

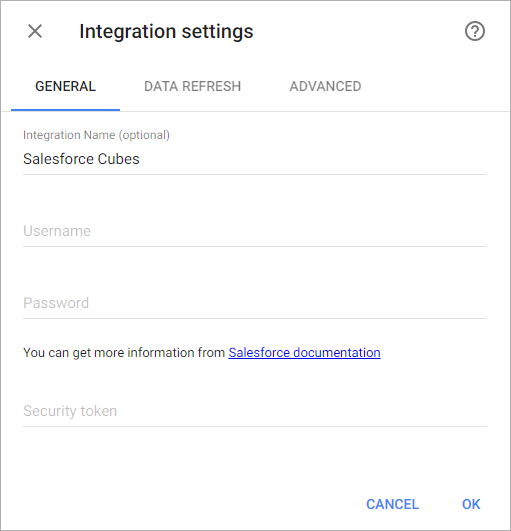
From your Salesforce account, get your Security token and enter it to the Integration settings window. Click OK.

After authorization, you’ll be able to share the integration with either individuals or the entire Team, rename or remove the integration. To view the options available for the integration, right click it in the list.

Creating a Dataset

A dataset is a collection of data in a tabular format that is created on one of the possible data sources. The datasets can be used to create dashboards or individual charts.

To create a dataset, click your Salesforce Cubes integration in the list and select Browse datasets. From the following page, select which data you want to add to use in your charts.

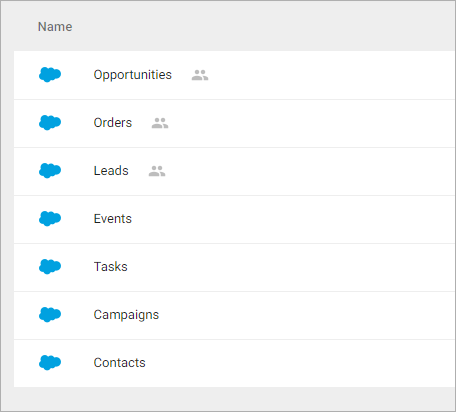
NOTE: Cloud Service Integrations have prebuilt data sets that are not editable.

Click dataset’s name for a description of each dataset.

Represents a contact, which is an individual associated with an account.

Dimensions

  1. Account Name – The name of the account that is the parent of this contact
  2. Birthdate – The birthdate of the contact
  3. Clean Status – Indicates the record’s clean status as compared with Data.com. Values are: Matched,Different, Acknowledged, NotFound, Inactive, Pending, SelectMatch, or Skipped.
  4. Email Bounced Date – If bounce management is activated and an email sent to the contact bounces, the date and time the bounce occurred.
  5. Email Bounced Reason – If bounce management is activated and an email sent to the contact bounces, the reason the bounce occurred.
  6. Deleted – Indicates whether the object has been moved to the Recycle Bin (true) or not (false)
  7. Email Bounced – If bounce management is activated and an email is sent to a contact, indicates whether the email bounced (true) or not (false).
  8. Last Activity Date – Value is one of the following, whichever is the most recent: (1) Due date of the most recent event logged against the record; (2) Due date of the most recently closed task associated with the record
  9. Last Referenced Date – The timestamp for when the current user last viewed a record related to this record.
  10. Last Viewed Date – The timestamp for when the current user last viewed this record.
  11. Lead Source – The source of the lead
  12. Mailing City – City of the mailing address
  13. Mailing State – State of the mailing address
  14. Mailing Country – Country of the mailing address
  15. Name – Concatenation of FirstName, MiddleName, LastName, and Suffix of the contact
  16. Tags – The array of tags associated with this lead

+Custom Dimensions

Measures

  1. Number of Contacts

+Custom Measures

Templates

  • Number of Contacts by Mailing

Represents and tracks a marketing campaign, such as a direct mail promotion, webinar, or trade show.

Dimensions

  1. Name – Name of the campaign
  2. Status – Status of the campaign, for example, Planned, In Progress
  3. Start Date – Starting date for the campaign
  4. End Date – Ending date for the campaign
  5. Active – Indicates whether this campaign is active (true) or not (false). Default value is false
  6. Last Activity Date – Value is one of the following, whichever is the most recent: (1) Due date of the most recent event logged against the record; (2) Due date of the most recently closed task associated with the record
  7. Last Referenced Date – The timestamp for when the current user last viewed a record related to this record
  8. Last Viewed Date – The timestamp for when the current user last viewed this record
  9. Assigned to – Full name and email of the user who owns this campaign
  10. Type – Type of campaign, for example, Direct Mail or Referral Program
  11. Tags – The array of tags associated with this lead

+Custom Dimensions

Measures

  1. Actual Cost – Amount of money spent to run the campaign
  2. Total Value Opportunities – Amount of money in all opportunities associated with the campaign, including closed/won opportunities
  3. Total Value Won Opportunities – Amount of money in closed or won opportunities associated with the campaign
  4. Budgeted Cost – Amount of money budgeted for the campaign
  5. Expected Response – Percentage of responses you expect to receive for the campaign
  6. Expected Revenue – Amount of money you expect to generate from the campaign
  7. Total Contacts – Number of contacts associated with the campaign
  8. Converted Leads – Number of leads that were converted to an account and contact due to the marketing efforts in the campaign
  9. Total Leads – Number of leads associated with the campaign
  10. Num Total Opportunities – Number of opportunities associated with the campaign
  11. Total Responses – Number of contacts and unconverted leads with a Member Status equivalent to “Responded” for the campaign
  12. Num Won Opportunities – Number of closed or won opportunities associated with the campaign
  13. Num Sent – Number of individuals targeted by the campaign. For example, the number of emails sent
  14. Campaigns Count – Campaigns Count

+Custom Measures

Templates

Instead of starting from scratch when building a chart, you can use a pre-built visualization. Simply click one of the templates from the list and it will be added to the dashboard filled with your data. You can then edit and customize this template like a usual chart created by you.

The following templates available for this dataset:

  • Number of Campaigns by Status and Type

Represents a business activity such as making a phone call or other to-do items. In the user interface, Task and Event records are collectively referred to as activities.

Dimensions

  1. Account Name – The name of the related Account
  2. Activity Date – Represents the due date of the task
  3. Call Type – The type of call being answered: Inbound, Internal, or Outbound
  4. Archived – Indicates whether the event has been archived (true) or not (false)
  5. Closed – Indicates whether the task has been completed (true) or not (false)
  6. High Priority – Indicates a high-priority task
  7. Recurrence – Indicates whether the task is scheduled to repeat itself (true) or only occurs once (false)
  8. Owner – Full name and email of the User who owns the record
  9. Priority – Indicates the importance or urgency of a task, such as high or low
  10. Recurrence Type – Indicates how often the task repeats. For example, daily, weekly, or every nth month
  11. Status – The current status of the task, such as In Progress or Completed
  12. Subject – The subject line of the task, such as “Call” or “Send Quote”
  13. Task Subtype – Provides standard subtypes to facilitate creating and searching for specific task subtypes. For example, Task, Email, Call
  14. Tags – The array of tags associated with this lead

Measures

  1. Tasks Count – Tasks Count

Represents an event in the calendar. In the user interface, event and task records are collectively referred to as activities.

Dimensions

  1. Account Name – The name of the related Account
  2. Start Date – Indicates the start date and time of the event
  3. End Date – Indicates the end date and time of the event
  4. All Day Event – Indicates whether the ActivityDate field (true) or the ActivityDateTime field (false) is used to define the date or time of the event
  5. Archived – Indicates whether the event has been archived
  6. Recurrence – Indicates whether the event is scheduled to repeat itself (true) or only occurs once (false)
  7. Assigned to – Full name and email of the user who owns the event
  8. Recurrence Type – Indicates how often the event repeats. For example, daily, weekly, or every nth month
  9. Subject – The subject line of the event, such as Call, Email, or Meeting
  10. Event Subtype – Provides standard subtypes to facilitate creating and searching for events
  11. Tags – The array of tags associated with this lead

Measures

  1. Events Count – Events Count

Represents a prospect or potential Opportunity.

Dimensions

  1. City – City for the address of the lead
  2. Clean Status – Indicates the record’s clean status as compared with Data.com. Values are: Matched,Different, Acknowledged, NotFound, Inactive, Pending, SelectMatch, or Skipped.
  3. Company – Company of the lead
  4. Converted Date – Date on which this Lead was converted
  5. Country – Country for the address of the lead 
  6. Email Bounced Date – If bounce management is activated and an email sent to the lead bounced, the date and time the bounce occurred.
  7. Email Bounced Reason – If bounce management is activated and an email sent to the lead bounced, the reason the bounce occurred.
  8. Industry – Industry the lead works in
  9. Converted – Indicates whether the Lead has been converted (true) or not (false)
  10. Deleted – Indicates whether the object has been moved to the Recycle Bin (true) or not (false)
  11. Last Activity Date – Value is one of the following, whichever is the most recent: (1) Due date of the most recent event logged against the record; (2) Due date of the most recently closed task associated with the record
  12. Last Referenced Date – The timestamp for when the current user last viewed a record related to this record
  13. Last Viewed Date – The timestamp for when the current user last viewed this record
  14. Lead Source – Source from which the lead was obtained
  15. Name – Concatenation of FirstName, MiddleName, LastName, and Suffix of the Lead
  16. Rating – Rating of the lead
  17. State – State for the address of the lead
  18. Status – Status code for this converted lead
  19. Tags – The array of tags associated with this lead
  20. Lead Owner – The user to whom the Lead is assigned

+Custom Dimensions

Measures

  1. Leads Count – Leads Count

+Custom Measures

Templates

Instead of starting from scratch when building a chart, you can use a pre-built visualization. Simply click one of the templates from the list and it will be added to the dashboard filled with your data. You can then edit and customize this template like a usual chart created by you.

The following templates available for this dataset:

  • Number of Leads by Country
  • Number of Leads by Raiting
  • Top 10 Industries by Number of Leads
  • Top 10 Lead Sources by Number of Leads

Represents an order associated with a contract or an account.

Dimensions

  1. Account Name – The name of the Account associated with this order
  2. Activated by – Full name and email of the User who activated this order
  3. Activated At – Date and time when the order was activated
  4. Billing City – City for the billing address for this order
  5. Billing Country – Country for the billing address for this order
  6. Billing State – State for the billing address for this order
  7. Bill To – Full name and email of the contact that the order will be billed to.
  8. Contract Number – Number of the contract associated with this order
  9. Order Start Date – Date at which the order becomes effective
  10. Order End Date – Date at which the order ends
  11. Contract Start Date – Date at which the contract becomes effective
  12. Contract End Date – Date at which the contract ends
  13. Reduction Order – Determines whether an order is a reduction order
  14. Last Referenced Date – The timestamp for when the current user last viewed a record related to this record
  15. Last Viewed Date – The timestamp for when the current user last viewed this record
  16. Name – Name for this order
  17. Purchase Date – Date of the purchase order
  18. Price Book Name – Name of the price book associated with this order
  19. Shipping City – City of the shipping address
  20. Shipping Country – Country of the shipping address
  21. Shipping State – State of the shipping address
  22. Status – The status of order
  23. Status Category – The status category for the order. An order can be either Draft or Activated.
  24. Type – The type of order

+Custom Dimensions

Measures

  1. Total Amount – The total amount for the order products associated with this order
  2. Orders Count – Orders Count

+Custom Measures

Templates

Instead of starting from scratch when building a chart, you can use a pre-built visualization. Simply click one of the templates from the list and it will be added to the dashboard filled with your data. You can then edit and customize this template like a usual chart created by you.

The following templates available for this dataset:

  • Number of Orders by Purchase Date

Represents an opportunity, which is a sale or pending deal.

Dimensions

  1. Account Name – The name of the account associated with this opportunity
  2. Campaign – The name of the related campaign
  3. Campaign Status – Status of the related campaign, for example, Planned, In Progress
  4. Campaign Type – Type of the related campaign, for example, Direct Mail or Referral Program
  5. Close Date – Date when the opportunity is expected to close
  6. Forecast Category – The name of the forecast category
  7. Closed – Indicates whether the opportunity has been closed (true) or not (false)
  8. Deleted – Indicates whether the object has been moved to the Recycle Bin (true) or not (false)
  9. Won – Indicates whether the opportunity has been won (true) or not (false)
  10. Last Activity Date – Value is one of the following, whichever is the most recent: (1) Due date of the most recent event logged against the record; (2) Due date of the most recently closed task associated with the record.
  11. Last Referenced Date – The timestamp for when the current user last viewed a record related to this record.
  12. Last Viewed Date – The timestamp for when the current user last viewed this record
  13. Lead Source – Source of this opportunity, such as Advertisement or Trade Show
  14. Name – A name for this opportunity
  15. Owner – Full name and email of the User who has been assigned to work this opportunity
  16. Price Book Name – The name of the related Pricebook
  17. Stage – Current stage of this record
  18. Opportunity Type – Type of opportunity. For example, Existing Business or New Business
  19. Tags – The array of tags associated with this lead

+Custom Dimensions

Measures

  1. Amount – Estimated total sale amount. For opportunities with products, the amount is the sum of the related products
  2. Expected Revenue – Is equal to the product of the opportunity Amount field and the Probability
  3. Probability – Percentage of estimated confidence in closing the opportunity
  4. Opportunities Count – Opportunities Count

+Custom Measures

Templates

Instead of starting from scratch when building a chart, you can use a pre-built visualization. Simply click one of the templates from the list and it will be added to the dashboard filled with your data. You can then edit and customize this template like a usual chart created by you.

The following templates available for this dataset:

  • Expected Revenue by Campaigns
  • Number of Opportunities by Stages
  • Number of Opportunities by Type
  • Top 10 Opportunity Account Names by Expected Revenue
  • Top 10 Opportunity Owners by Expected Revenue
  • Total Value of Closed Opportunities by Close Date over the last 30 days

Creating a Chart

Click a dataset or integration and select Create dashboard/Create chart/Create presentation to start building a chart (please note that presentations are available starting from the Standard Plan).

From the next page, you can choose to create your own chart from scratch, or you can apply one of the templates we created.

  • If you choose to build a new chart from scratch (“Blank” option), the Chart designer will open. Go here to learn how to create a chart in the Chart editor.
  • If you choose a template, a new chart will be added to a dashboard/saved chart/presentation (depending on the way you start the chart creation).
Was this article helpful?
Dislike 0
Views: 1636