

SalesLoft is the platform for modern sales engagement.
- How to connect my SalesLoft account with Slemma?
- How to get data from SalesLoft?
- How to create a chart on my SalesLoft integration?
Creating an Integration
To create an integration, head over to the Library tab (your home page) and click the plus button at the bottom right. Select Integration from the submenu.
From the next page, you can find SalesLoft with one of the following ways:
- Scroll down and select SalesLoft from the list of integrations;
- Use search icon from the top right corner of the window;
- Open the All dropdown and select Other.
Click the integration.
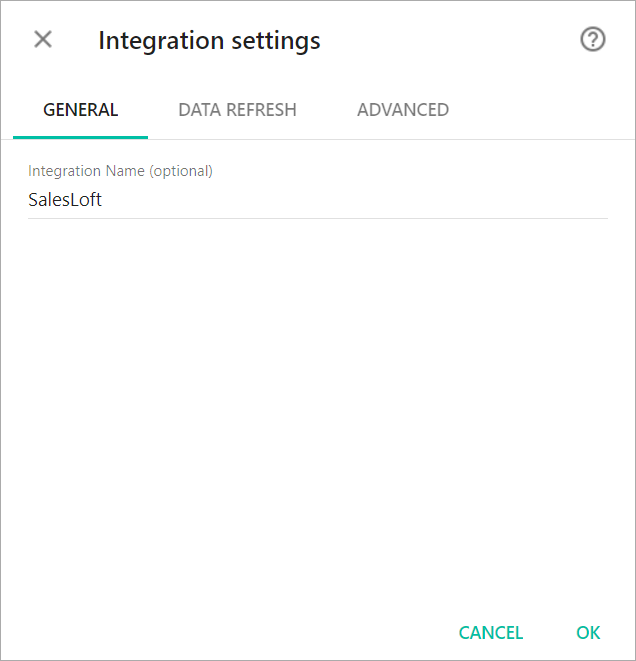
You’ll see the Integration settings dialog window. You can read more about data refresh options and advanced settings in the appropriate articles. Insert the credentials to connect to your account.
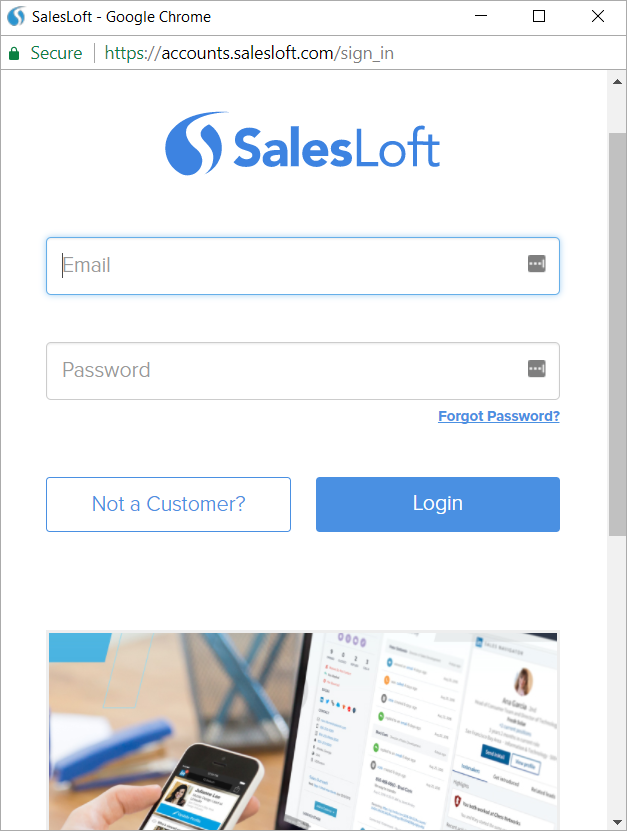
You’ll be directed to a page to sign in. Login to your SalesLoft account.
After authorization, the integration will be created and it will appear in your account in the list of objects. Now you are able to share the integration with either individuals or the entire Team, rename or remove the integration. To view the options available for the integration, right click it in the list.
Creating a Dataset
Dataset is a collection of data in a tabular format that is created on one of the possible data sources. The datasets can be used to create dashboards or individual charts.
Cloud Service Integrations have prebuilt data sets that are not editable.
To create a dataset, click your SalesLoft integration in the list and select Browse datasets.
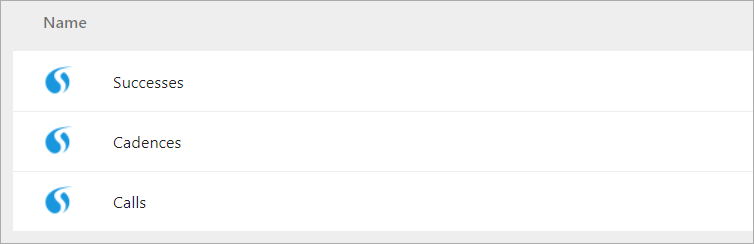
Click dataset’s name for a description of each dataset.
This data source contains information about results of a phone interactions with a person.
- Person – Called person’s name
- Call time – Created at datetime
- Sentiment – Emotion of phone call
- Disposition – Outcome of a call
- Cadence – Name of the Cadence where the call was made
- Step name – Name of the Step where the call was made
- Step number – Position of the Step where the call was made
- Account name – Name on the account
- Account email – Email address of the account
- Calls Count – Calls Count
- Call duration – Duration of call in seconds
This data source contains information about user defined engines to run their outbound process.
- Name – The name of this cadence
- Created – Created at datetime
- Cadences Count – Cadences Count
- Target Daily People – The number of people that this cadence should receive per day
- Total People Count – The number of active people in this cadence
A success is recorded manually by a user when they take an action that they classify as successful. This could be reaching a prospect, getting a demo, etc. It is important to understand how success is used by the integrating team before making assumptions about what a success is.
- Account name – Name on the account
- Account email – Email address of the account
- Person – The person who a success occurred on
- Success Window Started at – Datetime of when this person began being work, leading up to the success
- Succeeded at – Datetime of the success
- Deleted – Whether this success was removed manually
Measures
- Successes Count – Successes Count
- Total Mails – The total number of emails made in this success window
- Total Calls – The total number of calls made in this success window
- Total Other Touches – The total number of other touches made in this success window
Creating a Chart
Click a dataset or integration and select Create dashboard/Create chart/Create presentation to start building a chart (please note that presentations are available starting from the Standard Plan).
From the next page, you can choose to create your own chart from scratch, or you can apply one of the templates we created.
- If you choose to build a new chart from scratch (“Blank” option), the Chart designer will open. Go here to learn how to create a chart in the Chart editor.
- If you choose a template, a new chart will be added to a dashboard/saved chart/presentation (depending on the way you start the chart creation).