

From this article you’ll learn:
- How to integrate your Shopify account with Slemma
- How to get data from Shopify
- How to create a chart on Shopify data
- Which templates are available in Slemma for the Shopify integration
Creating an Integration
From your Slemma account, head over to the Library page and click the plus button at the bottom right. Select Integration from the submenu.
In the following page, you can find Shopify with one of the following ways:
- Scroll down and select Shopify from the list of Integrations.
- Use search to find Shopify from the list of Integrations.
- Choose Shopify using All dropdown list > E-Commerce.
You’ll see the Integration settings dialog window. You can select the frequency for the automatic updates on the DATA REFRESH tab, or set weeks settings on the ADVANCED tab.
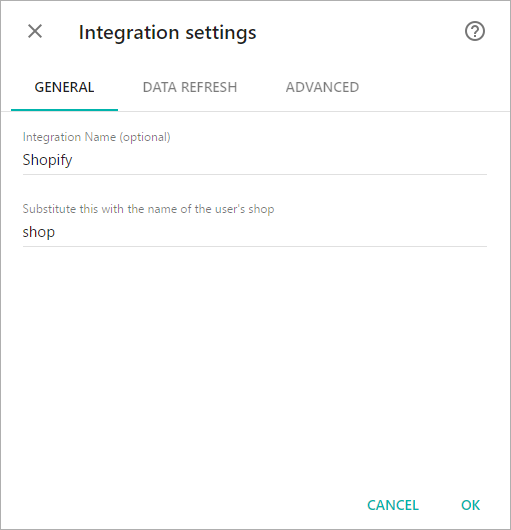
Enter the name of your shop. Please note that you need to enter the name of the shop only. For example, if your shop has address like your-store-name.myshopify.com, you need to type in only your-store-name.
If you use a custom domain for your shop, you need to find your Shopify-hosted domain name and copy the subdomain (from your Shopify admin, click Online Store, then click Domains and find it under the Manage domains list).
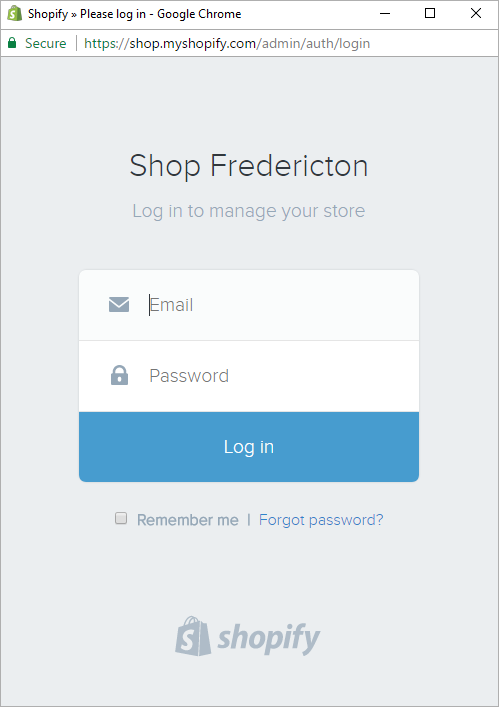
Once you provide your shop name and click OK, you’ll see a page to sign in.
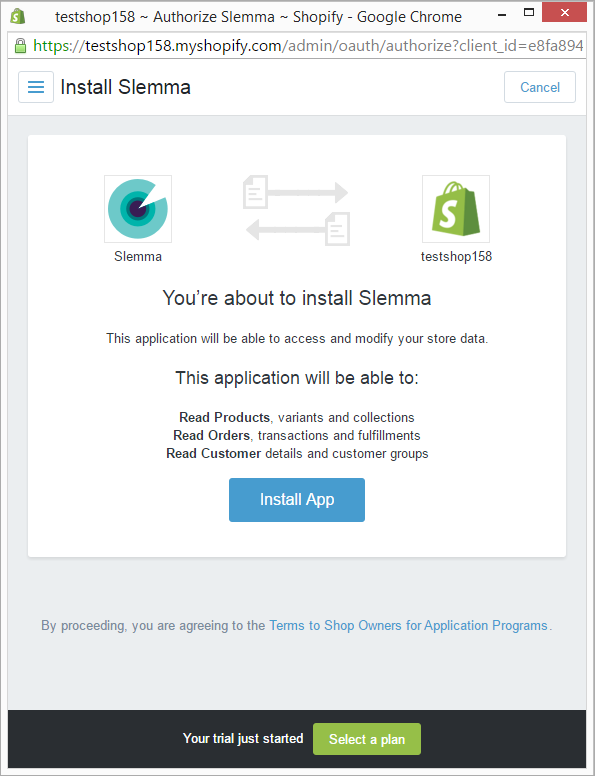
We’ll need your permission to install our application and get an access to your data. If you agree to the terms, click Install App.
After authorization, you’ll be able to share the integration with either individuals or the entire Team, rename or remove the integration. To view the options available for the integration, right click it in the list.
Creating a Dataset
To create a dataset, click your Shopify integration in the list and select Browse datasets. From the following page, select which data you want to add to use in your charts.
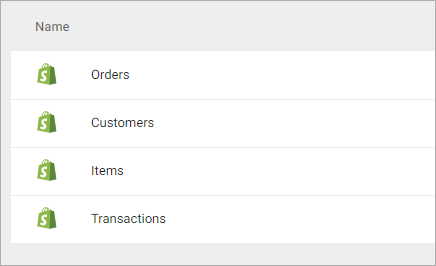
NOTE: Cloud Service Integrations have prebuilt data sets that are not editable.
Creating a Chart
Click a dataset or integration and select Create dashboard/Create saved chart/Create presentation to start building a chart (please note that presentations are available starting from the Standard Plan).
From the next page, you can choose to create your own chart from scratch, or you can apply one of the templates we created.
- If you choose to build a new chart from scratch (“Blank” option), the Chart designer will open. Go here to learn how to create a chart in the Chart designer.
- If you choose a template, a new chart will be added to a dashboard/saved chart/presentation (depending on the way you start the chart creation).
Templates
Instead of starting from scratch when building a chart, you can use a pre-built visualization. Simply click one of the templates from the list and it will be added to the dashboard filled with your data. You can then edit and customize this template like a usual chart created by you.
The following templates are available for the Shopify integration:
- Average Order Value by Сustomer Location over the last 30 days
- Average Order Value over the last 30 days
- Gross Weight of Items Shipped by Country
- Monthly Revenue over the last 12 months
- Number of Items Sold by Country
- Number of Orders per Customer
- Payment Gateway success rate
- Refunds by Country
- Revenue by Product
- Revenue by Product Type
- Revenue by Product Type over the last 30 days
- Revenue by Product Vendor
- Revenue by Traffic Source
- Taxes by Shipping Country
- Top 10 Customer Locations
- Top 10 Customers by Number of Orders
- Top 10 Referring Websites by Sales
- Total Revenue over time