

This integration enables you to visualize Slack usage statistics: number of records by:
- Public channels
- Users
- Time
- Type of a record (bot messages, messages, channel leaves or file shares)
Users have an access only to the public channels they are subscribed to. To access the whole data for your team in Slack, you need to be that team’s admin or owner.
If your team is on the Slack’s free plan, you will see only the statistics that Slack allows for the free plan (10k most recent messages).
For a paid plan, there is a limit of 100K messages for each Slack dataset.
From this article you can learn:
- How to create a connection with Slack
- How to get data from Slack
- How to create a chart on Slack data
- Which templates are available for the Slack integration
Creating an Integration
From your Slemma account, head over to the Library page and click the plus button at the bottom right. Select Integration from the submenu.
In the following page, you can find Slack with one of the following ways:
- Scroll down and select Slack from the list of Integrations.
- Use search to find Slack from the list of Integrations.
- Choose Slack using All dropdown list > Other.
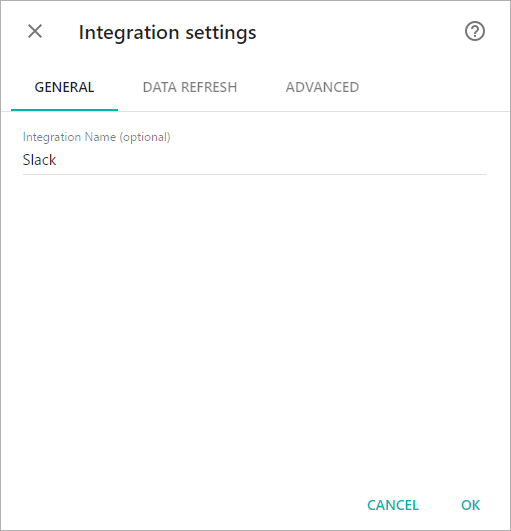
You’ll see the Integration settings dialog window. You can select the frequency for the automatic updates on the DATA REFRESH tab, or set weeks settings on the ADVANCED tab. Click OK.
You’ll be directed to a page to sign in.
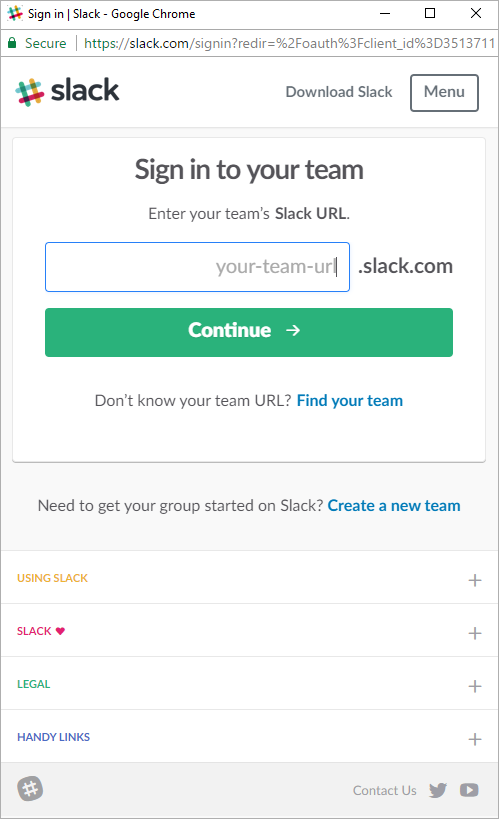
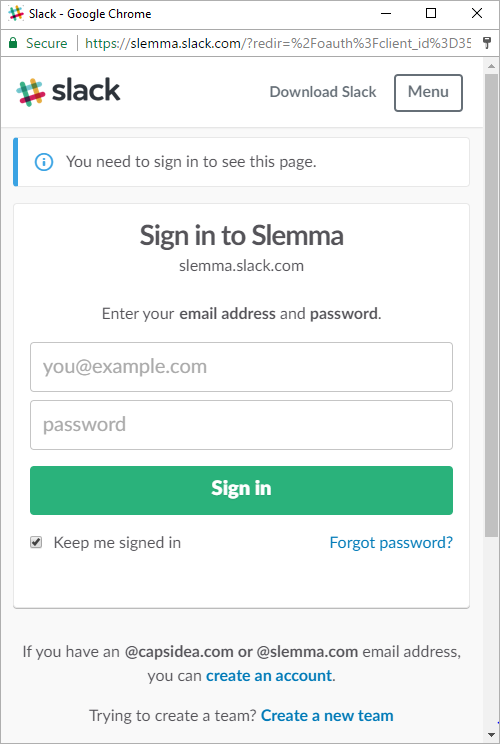
Type in your Slack domain, click Continue, and then enter the email address and password to sign in.
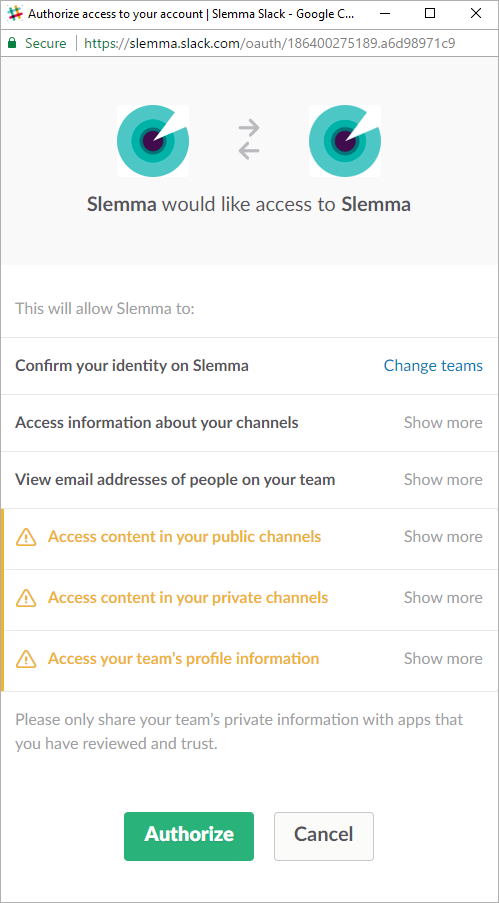
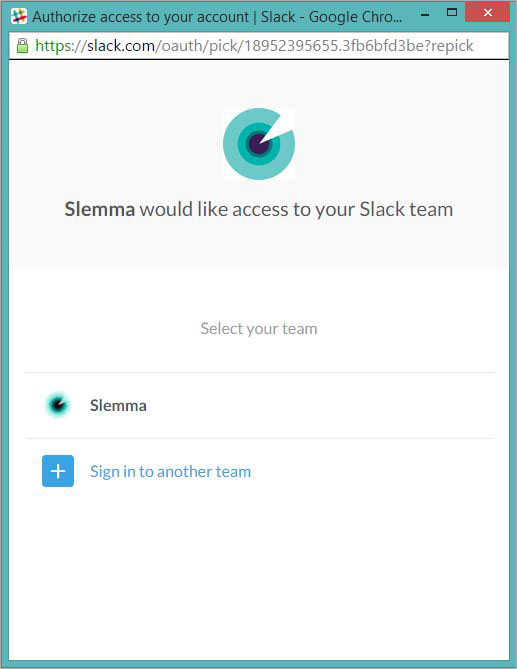
We’ll need your permission to access your Slack account. If you agree to the terms, select Authorize. If you’d like to turn back without completing the integration, simply click Cancel.
If you‘ve already signed in a domain, but want to use another one for integration, you can click the Change teams link.
Choose a team from the list or click Sign in to another team to open the Sign in page.
After authorization, you’ll be able to share the integration with either individuals or the entire Team, rename or remove the integration. To view the options available for the integration, right click it in the list.
Creating a Dataset
To create a dataset, click your Slack integration in the list and select Browse datasets. From the following page, select which data you want to add to use in your charts.
NOTE: Cloud Service Integrations have prebuilt data sets that are not editable.
Creating a Chart
Click a dataset or integration and select Create dashboard/Create saved chart/Create presentation to start building a chart (please note that presentations are available starting from the Standard Plan).
From the next page, you can choose to create your own chart from scratch, or you can apply one of the templates we created.
- If you choose to build a new chart from scratch (“Blank” option), the Chart designer will open. Go here to learn how to create a chart in the Chart designer.
- If you choose a template, a new chart will be added to a dashboard/saved chart/presentation (depending on the way you start the chart creation).
Templates
Instead of starting from scratch when building a chart, you can use a pre-built visualization. Simply click one of the templates from the list and it will be added to the dashboard filled with your data. You can then edit and customize this template like a usual chart created by you.
The following templates are available for the Slack integration:
- Number of Messages by day of the week
- Number of Messages Sent over the last 30 days
- Number of Teammates Joined Channels by day of the week
- Top 10 Channels by Number of messages sent
- Top 10 Writers by Number of messages sent