

Let’s take a look at a data source containing a column with multiple values. For example, it might be a response summary to a questionnaire in which you can choose multiple answers simultaneously on occasion.
Split is very helpful in such cases, when a detailed analysis of the multi-answer column is required.
NOTE: Split option is not available for the database sources.
Let’s take a look at the example below. The QuestionMulti column below corresponds to a mentioned multi-answer response.
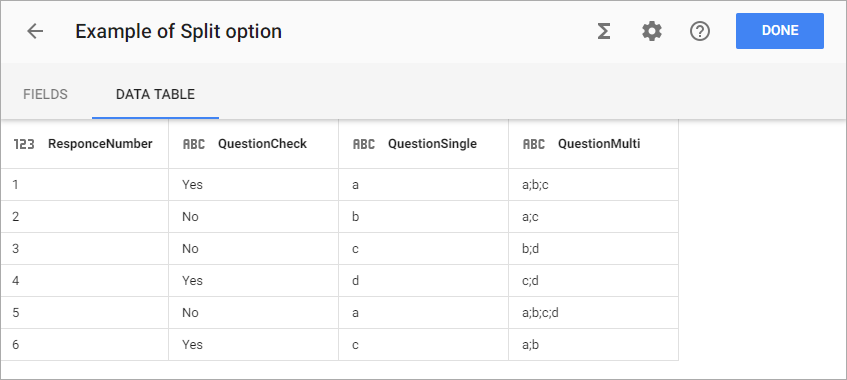
When Split is used, no visible effect occurs. But when the dataset is saved, the dimension associated with the column to be split is populated (distinctly) with every part of the split value. Each row is associated with each element of the split column belonging to that row.
The splitting can be set up during the dataset creation, or on a prepared dataset in the Dataset editor, by clicking the appropriate column (for the columns with categorical data – string or geography types) and selecting the checkbox for the Split option. This will display a field below to enter a separating symbol (or sequence of symbols). The column will be split accordingly.
Let’s see how it works by applying Split to the QuestionMulti column and specifying a separating symbol as ‘;‘ (sans quotes).

Now if we build charts for, say, response frequencies, we shall get results like these:
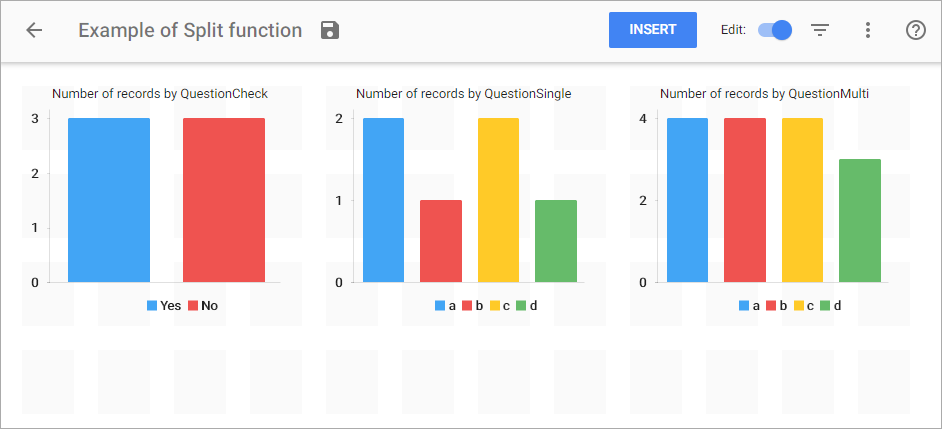
On the first two charts we can see that number of records is consistent and it reflects the total number of responses. But the third chart is built upon the split column of the same data source and it shows the total number of appearances for each option (which is higher than the total number of responses due to each response having multiple simultaneous answers).
Number of records, in this case (for non-split columns), is still unchanged as you can see and it reflects the exact number of responses.
There is a certain quirk to split function behavior though, when applied together with the distinct-сount measure on the same dimension:
- In case no additional filters/groupings are set up, the distinct-count measure will take precedence before split setting for the dimension.
- If there are filters/groupings added, the split takes priority.
The example of such behavior can be seen below.
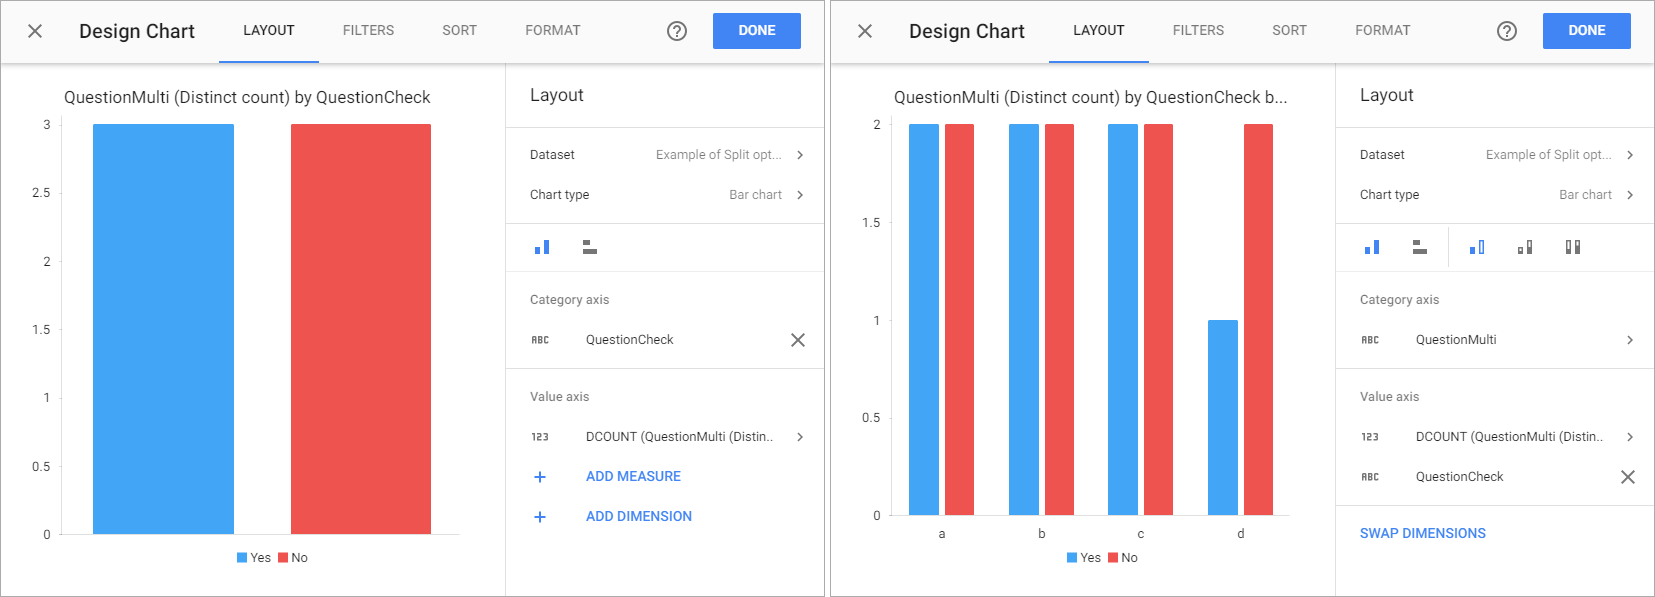
The first chart as you can see shows only three distinct answers to QuestionMulti when grouped by QuestionCheck – and that is exactly the case with raw, non-split data: the distinct-count measure takes priority in this case.
The second chart shows an added grouping by the QuestionMulti dimension and shows the real number of distinct answers: each answer (a, b, c, d) is present for both QuestionCheck options.