

In this article, you’ll find the answers to the following questions:
- How to connect my SurveyMonkey account with Slemma?
- How to get data from SurveyMonkey?
- How to create a chart on my SurveyMonkey integration?
Creating an Integration
From your Slemma account, head over to the Library page and click the plus button at the bottom right. Select Integration from the submenu.
In the following page, you can find SurveyMonkey with one of the following ways:
- Scroll down and select SurveyMonkey from the list of Integrations.
- Use search to find SurveyMonkey from the list of Integrations.
- Choose SurveyMonkey using All dropdown list > Marketing.
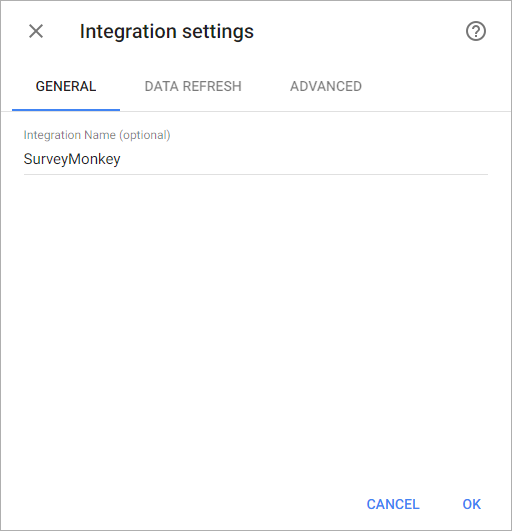
You’ll see the Integration settings dialog window. You can select the frequency for the automatic updates on the DATA REFRESH tab, or set weeks settings on the ADVANCED tab. Click OK.
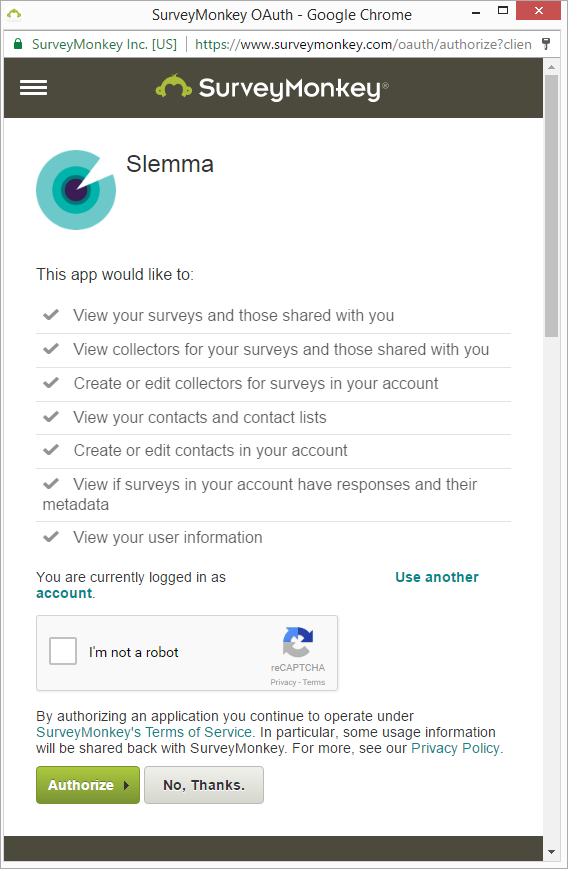
You’ll be directed to a page to sign in. Login to you SurveyMonkey account and grant Slemma permission to access your data (don’t forget to check “I am not a robot” box).
Once you’ve granted permission, you’ll be able to share the integration with either individuals or the entire Team, rename or remove the integration. To view the options available for the integration, right click it in the list.
Creating a Dataset
A dataset is a collection of data in a tabular format that is created on one of the possible data sources. The datasets can be used to create dashboards or individual charts.
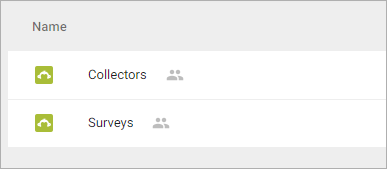
To create a dataset, click your SurveyMonkey integration in the list and select Browse datasets. From the following page, select which data you want to add to use in your charts.
NOTE: Cloud Service Integrations have prebuilt data sets that are not editable.
Click dataset’s name for a description of each dataset.
This data source contains information about all your collectors which allow you to collect survey responses with a link to your survey. Dimensions Measures Templates This data source contains information about all your surveys such as survey count by category. Dimensions Measures Templates
Creating a Chart
Click a dataset or integration and select Create dashboard/Create saved chart/Create presentation to start building a chart (please note that presentations are available starting from the Standard Plan).
From the next page, you can choose to create your own chart from scratch, or you can apply one of the templates we created.
- If you choose to build a new chart from scratch (“Blank” option), the Chart designer will open. Go here to learn how to create a chart in the Chart designer.
- If you choose a template, a new chart will be added to a dashboard/saved chart/presentation (depending on the way you start the chart creation).