

In this article, you’ll find the answers to the following questions:
- How to edit the chart’s data and type?
- How can I rearrange charts?
- How to set the charts’ order?
- How to resize a chart?
- How to copy/duplicate/delete a chart?
- How to download a chart or chart’s data to my computer?
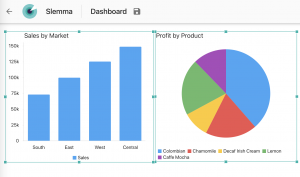
Editing chart
When the chart is on a dashboard, you can change its type, measures and dimensions, filters and sorting. There are two ways to do this:
- Select a chart, click the gear wheel icon
 in the top right corner of the chart and choose the Edit chart icon from the appeared menu. You will be redirected to chart editor.
 - Select a chart, click the gear wheel icon in the top right corner of the chart and choose one of the options. You will be able to edit chart’s data and design right on the dashboard.
Arranging Charts
You can easily arrange charts and media blocks on the dashboard. Click and drag your charts to rearrange their positioning.
Move Multiple Charts at Once
By default, a new dashboard has a Tiled layout. Moving several objects is not allowed in this type of layout.
If you choose the Floating layout for your dashboard, you will be able to move multiple charts at once. To do so, select multiple charts by clicking and holding on an empty space on your dashboard, and drag the grey box that appears over the charts you’d like to select.
Selected charts will have a blue outline. Drag them as you would drag a single chart to move all of them at once.
Setting Charts order
By default, a new dashboard has a Tiled layout. In this type of layout, overlapping is not allowed.
If you choose the Floating layout for your dashboard, you’ll be able to overlap charts and media blocks. To set up the charts order, right click the chart and hover over Order.
Resize Charts
Click the chart to select it. Selected chart will have a blue outline. Click and drag the selection border to resize it.
Copy/Delete/Duplicate Charts
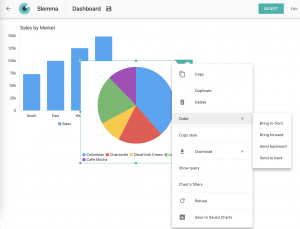
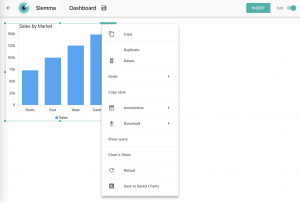
Right click the chart to open the chart context menu:
Copy. When copying chart it is saved to buffer and you can paste it on the other tab. Or simply use hot keys ctrl+c / ctrl+v (cmd+c / cmd+v for Mac).
Duplicate. When duplicating chart, the copy will be inserted right on the same dashboard tab. Once duplicated, your chart is completely separate from the original, so changing the original will not affect the new chart and vice versa.
Delete. This operation cannot be undone.
Order. (For Floating layout) If you have several charts, you can set up their order by moving them to the back or to the front.
Copy style. You can easily apply chart formatting (font, colors, labels and etc.) to any other chart on the dashboard. Click Copy style, then select another chart and select Paste style in the context menu.
Reload. This option is useful, for example, when you got a ‘timeout’ error from your database and the chart doesn’t display any data at the moment.
Save as Saved Chart. You can save your chart to the Saved charts page and then insert it to any other dashboard.
How to Download a Charts / Export Chart’s Data
You can export chart as files with chart data in *.csv/*.xls and images in *.png/*.svg. To do that, right click the chart to open the context menu, select Download and choose the needed format.
This option is available starting from Small Business plan.
Note that Slemma have some restrictions on the size of the downloaded file:
- Max file size limit is 10 Mb
- Max number of rows in the exported file is 100K
When you reach the limit, you get an appropriate message at the end of the file.