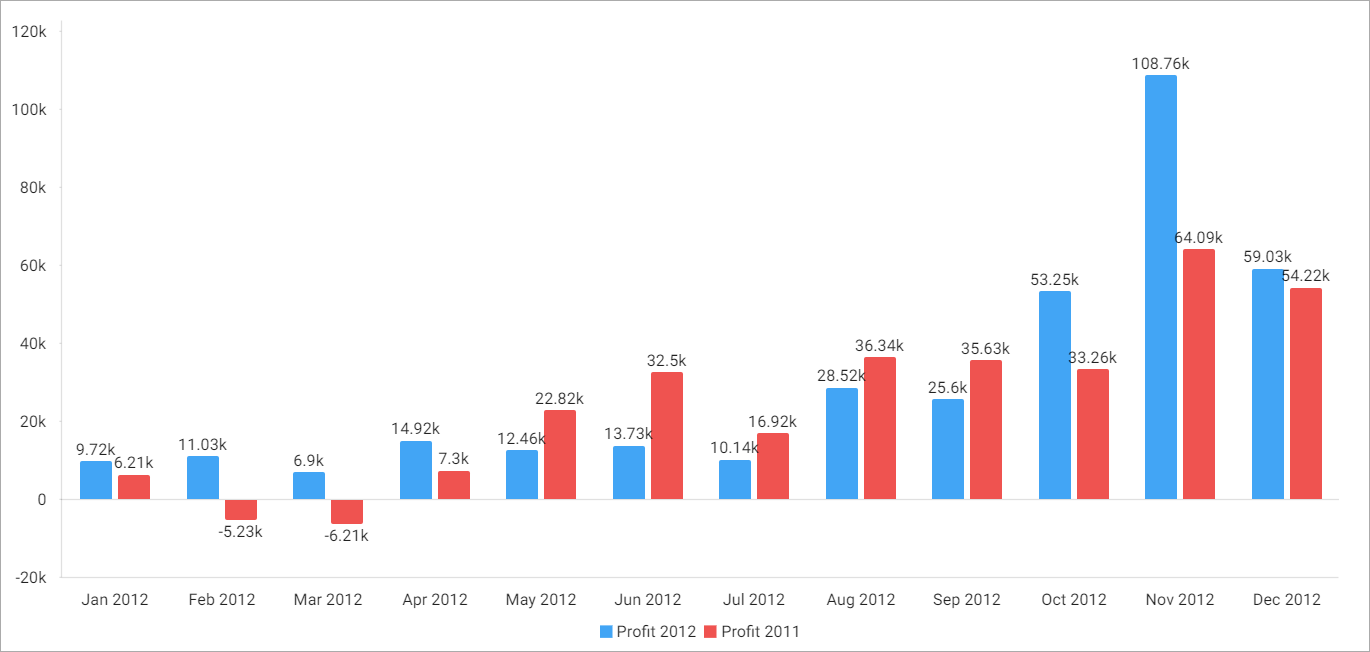
Let’s imagine that you need to compare data for the displayed period with the same data for the previous period, e.g. a month of the current year with the same month of the previous year.
NOTE: You can use a pre-build formula to create this chart – please check this article for more details.
To get the desired result, you should create a calculated measure using MDX formulas. Let’s consider step-by-step the process of such chart creation.
1) Open a chart designer and choose the desired chart type (let’s choose a bar chart for our example).
2) Place the desired Date dimension under Category axis and select the desired level to display (let’s take months).
3) Add the desired measure.
4) Click to add a second measure. Scroll down and choose the Add calculation option.
5) In the formula box of the Calculated measure window, insert the following calculation:
(ParallelPeriod([Date.Hierarchy].[Years],1, [Date.Hierarchy].CurrentMember),[Your_Measure])
where Date is the name of your date dimension that you’ve added to the chart under Category axis, Years – the level by which you display your Date dimension, Your_Measure – the name of the measure that you’ve added to the chart on the third step of our instruction.
6) Click OK to save the newly created measure and add it to the chart.
7) Next, filter your date dimension to display the desired year (a previous year will be determined automatically).
This formula will display values for each month in a year-over-year comparison.
You’ll see something like this:

Where Profit 2012 series displays values for 2012 year, Profit 2011 – for the previous 2011 year.
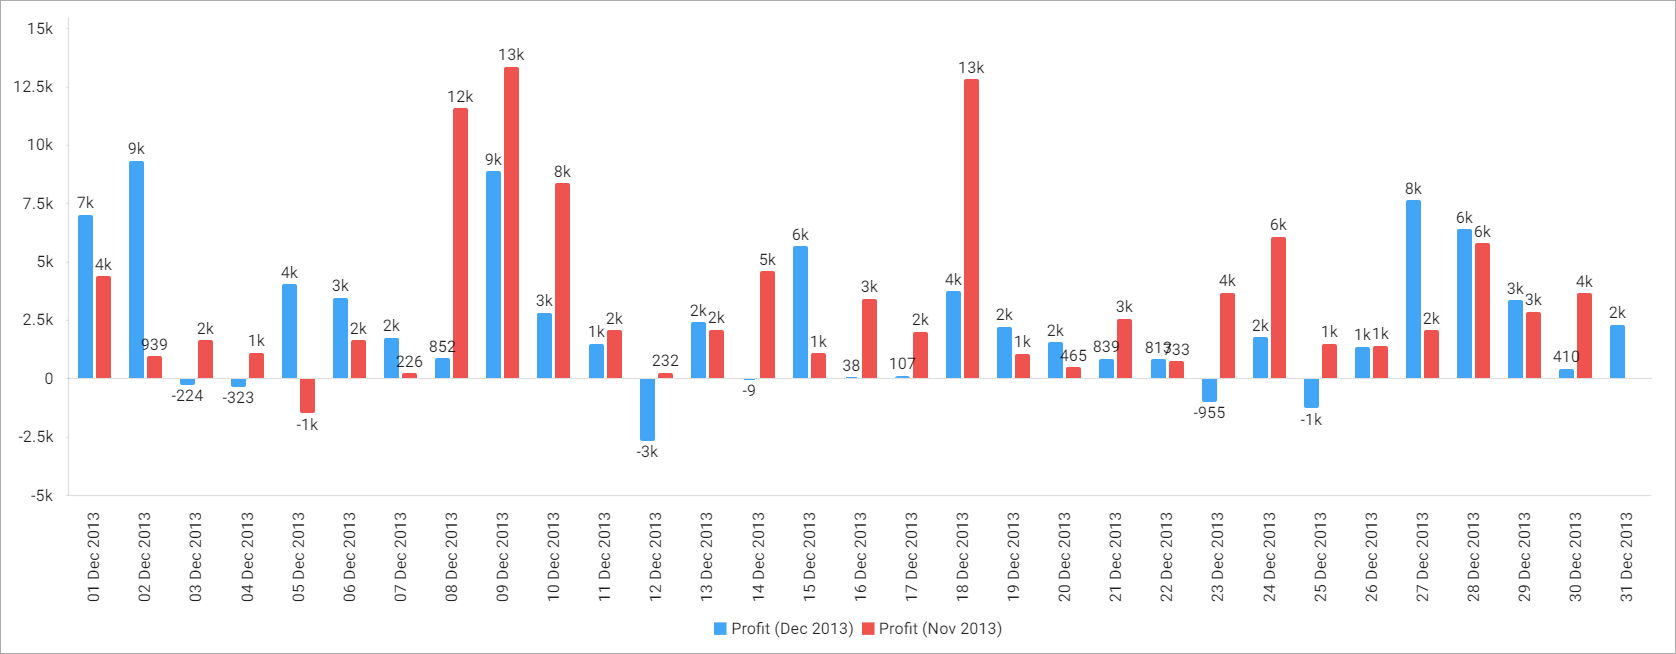
The same way you can build a chart with month-over-month comparison displayed by days:
(ParallelPeriod([Date.Hierarchy].[Month],1, [Date.Hierarchy].CurrentMember),[Your_Measure])


