There are two versions of Salesforce connector in Slemma:
- Salesforce Reports – creates datasets based on your Salesforce reports. Slemma supports two types of Salesforce reports: SUMMARY (only primary information) and TABULAR. So when you create a dataset on Salesforce integration, you’ll see in the list only reports that have these types (one Slemma dataset for each Salesforce report). You should have REST API enabled for this integration.
- Salesforce Cubes – creates datasets based on your Salesforce dimensions and measures organized in Cubes. You should have BULK API enabled for this integration.
In this article, we’ll describe a Salesforce Reports integration. If you need to learn more about Salesforce Cubes, please read this article.
Here you’ll find the answers to the following questions:
- How to create a Salesforce Reports integration?
- What should I do if I get the message “Looks like API access isn’t currently enabled in your Salesforce account”?
- What are the limitations for the Salesforce Reports connection?
- How to get data from Salesforce Reports?
- How to create a chart on Salesforce Reports data?
Creating an Integration
From your Slemma account, head over to the Library page and click the plus button at the bottom right. Select Integration from the submenu.
In the following page, you can find Salesforce Reports with one of the following ways:
- Scroll down and select Salesforce Reports from the list of Integrations.
- Use search to find Salesforce Reports from the list of Integrations.
- Choose Salesforce Reports using All dropdown list > CRM.
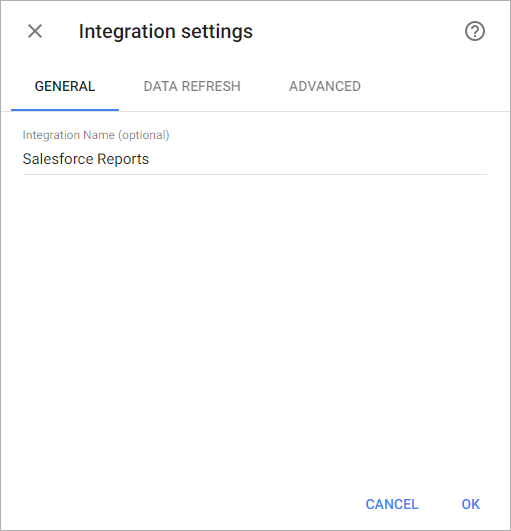
You’ll see the Integration settings dialog window. You can select the frequency for the automatic updates on the DATA REFRESH tab, or set weeks settings on the ADVANCED tab. Click OK.

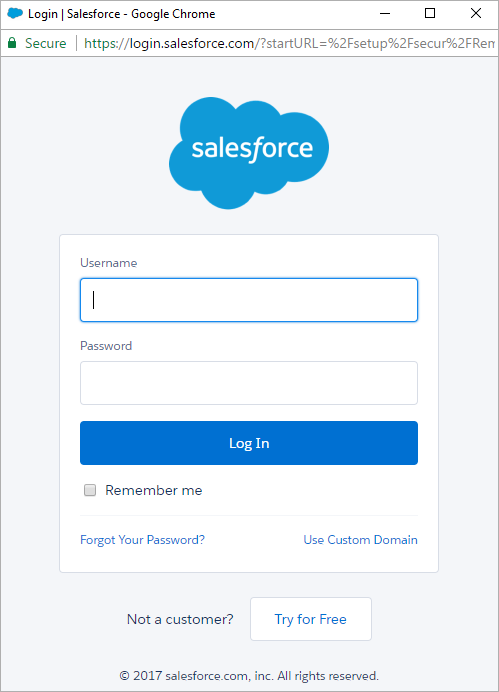
You’ll be directed to a page to sign in. Enter the email address and password to log into your Salesforce account.

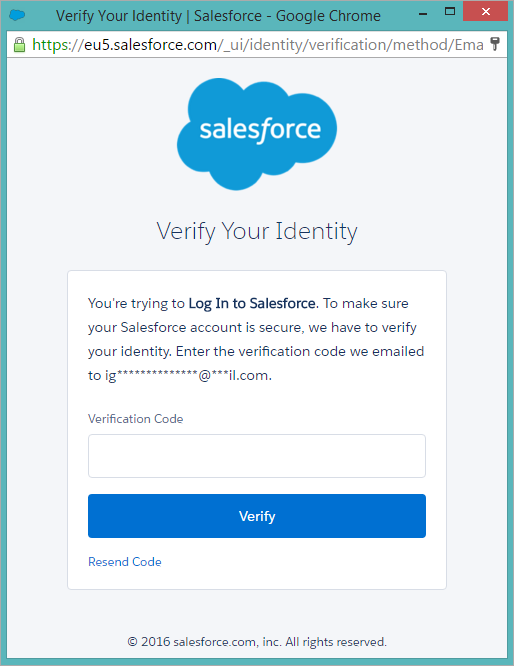
In some cases, Salesforce will require to verify your identity. Enter the verification code that you get via email and click Verify.

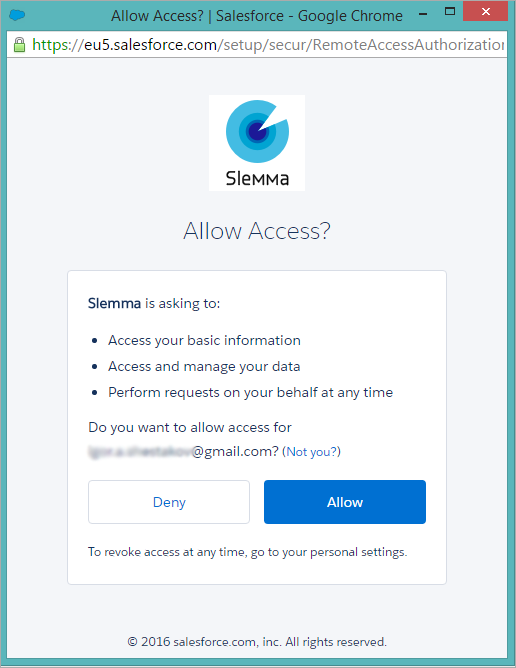
We’ll need your permission to access your account. If you agree to the terms, select Allow. If you’d like to turn back without completing the integration, simply click Deny.

Once you’ve granted permission, you’ll be able to share the integration with either individuals or the entire Team, rename or remove the integration. To view the options available for the integration, right click it in the list.
How to enable the REST API for Salesforce
To create an integration, you need to enable the REST API for the connected Salesforce account.
Please read this guide to learn more about enabling REST API in Salesforce.
Limitations
For Slemma connection, we use Salesforce Reports and Dashboards REST API.
When working with this API, consider these restrictions:
- The API can process only reports that contain up to 100 fields selected as columns.
- The API returns up to the first 2,000 report rows. You can narrow results using filters.
The full list of restrictions you can find here.
Creating a Dataset
To create a dataset, click your integration in the list and select Browse datasets. From the following page, select which data you want to add to use in your charts.
Slemma supports two types of Salesforce reports: SUMMARY (only primary information) and TABULAR. So when you create a dataset on Salesforce integration, you’ll see only reports that have these types in the list (one Slemma dataset for each Salesforce report).
NOTE: Cloud Service Integrations have prebuilt data sets that are not editable.
Creating a Chart
Click a dataset or integration and select Create dashboard/Create chart/Create presentation to start building a chart (please note that presentations are available starting from the Standard Plan).
From the next page, you can choose to create your own chart from scratch, or you can apply one of the templates we created.
- If you choose to build a new chart from scratch (“Blank” option), the Chart designer will open. Go here to learn how to create a chart in the Chart editor.
- If you choose a template, a new chart will be added to a dashboard/saved chart/presentation (depending on the way you start the chart creation).

